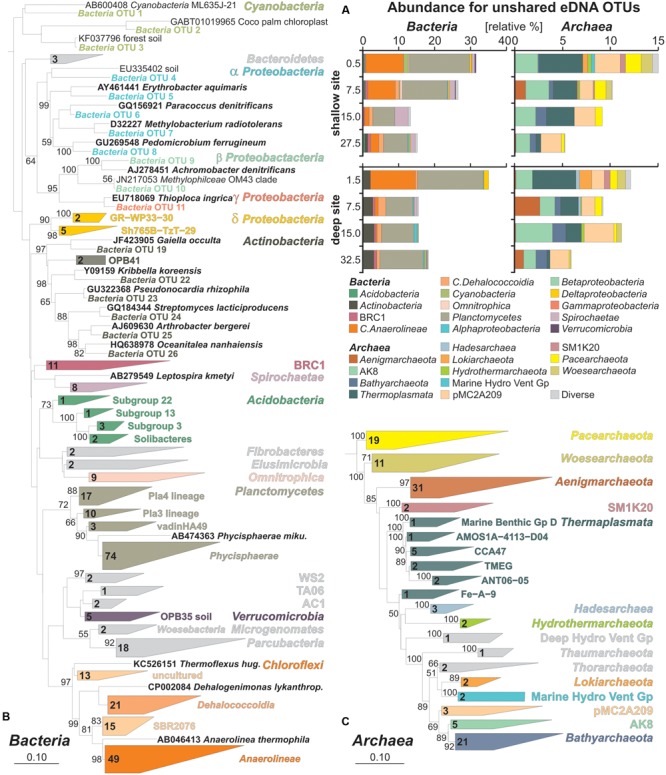
FIGURE 4.

Relative abundances of bacterial and archaeal OTUs specific to extracellular DNA and phylogenetic trees based on their partial 16S rRNA gene sequences. (A) Bacterial and archaeal bar charts plotted for taxa based on OTUs specific to the unshared eDNA. (B) Maximum likelihood tree with bootstrap values established for representative bacterial OTU sequences exclusive to the eDNA with database references and accession numbers in boldface types. (C) Maximum likelihood tree established for representative archaeal OTU sequences exclusive to the eDNA with database references and accession numbers in boldface types.
