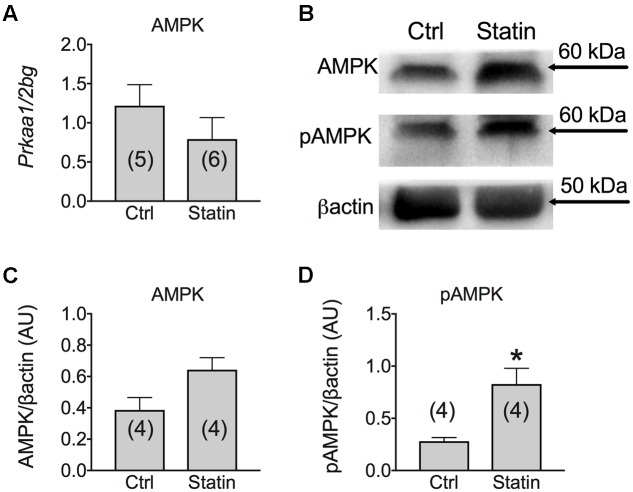
FIGURE 6.
(A) Real-time PCR analysis of mRNA expression level of AMP Kinase (AMPK) gene involved in muscle energetic metabolism in VL muscle biopsies of patients in therapy with statin showing sign of myopathy. Histograms show quantification of transcript levels for AMPK normalized by the beta-2 microglobulin gene. In each graph, the bars represent the mean values ± SEM in myopathic subjects (Statin) compared with those of untreated subjects (Ctrl) from the number of subjects indicated in brackets. (B) Representative Western blot showing the expression level of total AMPK protein and its phosphorylated form in muscle tissues. The blots were reacted with specific antibodies. β-actin was used to normalize the blot. Histograms show quantification of relative protein levels of total AMPK (C) and pAMPK (D) obtained by densitometric analysis of each protein normalized with β-actin, as reference standard, and represented as AU. Each bar represents the mean ± SEM from the number of muscle biopsies as indicated. ∗Significantly different with respect to the own control (P < 0.05) by Student’s t-test.

