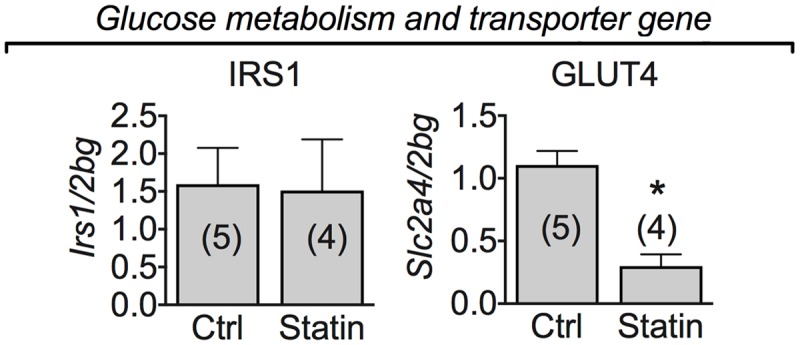
FIGURE 7.

Real-time PCR analysis of mRNA expression level of genes involved in glucose metabolism and transporter genes in VL muscle biopsies of patients in therapy with statin showing sign of myopathy. Histograms show quantification of transcript levels for IRS1, and GLUT-4 normalized by the beta-2 microglobulin gene. In each graph, the bars represent the mean values ± SEM in myopathic subjects (Statin) compared with those of untreated subjects (Ctrl) from the number of subjects indicated in brackets. ∗Significantly different with respect to the own control (P < 0.05) by Student’s t-test.
