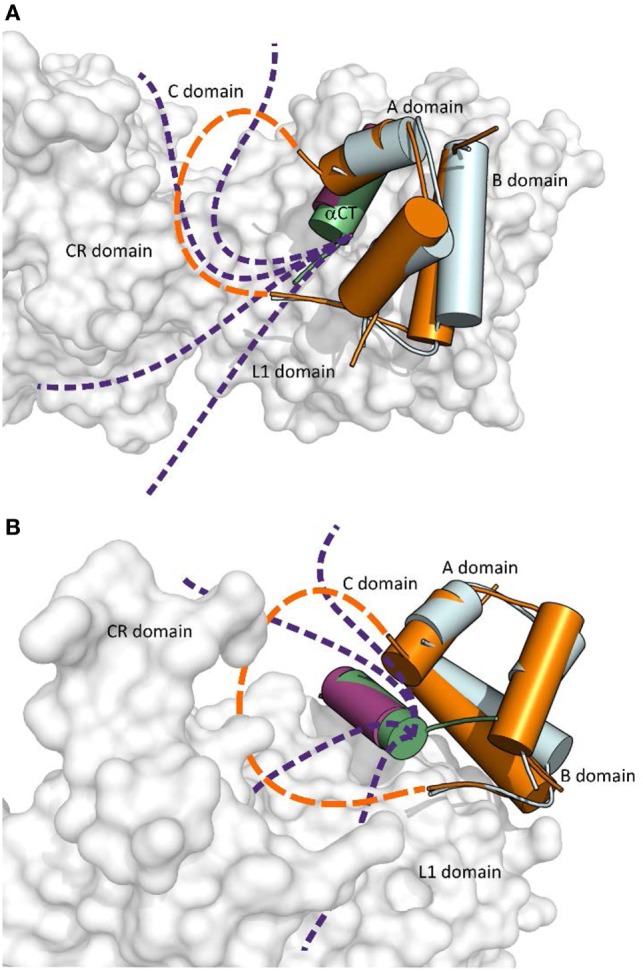
Figure 4.

The cartoon showing putative mutual arrangement and positioning of the IGF-1 C domain and C-terminal αCT-B residues on the IR-B receptor. (A) An overlay of receptor-bound conformations of human insulin (in cyan, from the PDB ID 4OGA) and human IGF-1 (in orange, from the PDB ID 4XSS). IR L1 and CR domains are in gray, IR αCT-A is in purple and IGF-1 αCT is in green. The dashed orange connecting line indicates a putative position of IGF-1 C domain residues and the purple dashed lines indicate a putative positional range of αCT-B C-terminal amino acid residues, which overlie the L1 domain and are covered by the C domain loop. (B) Rotated view of the cartoon shown in (A). Prepared in PyMol.
