
Figure 2.
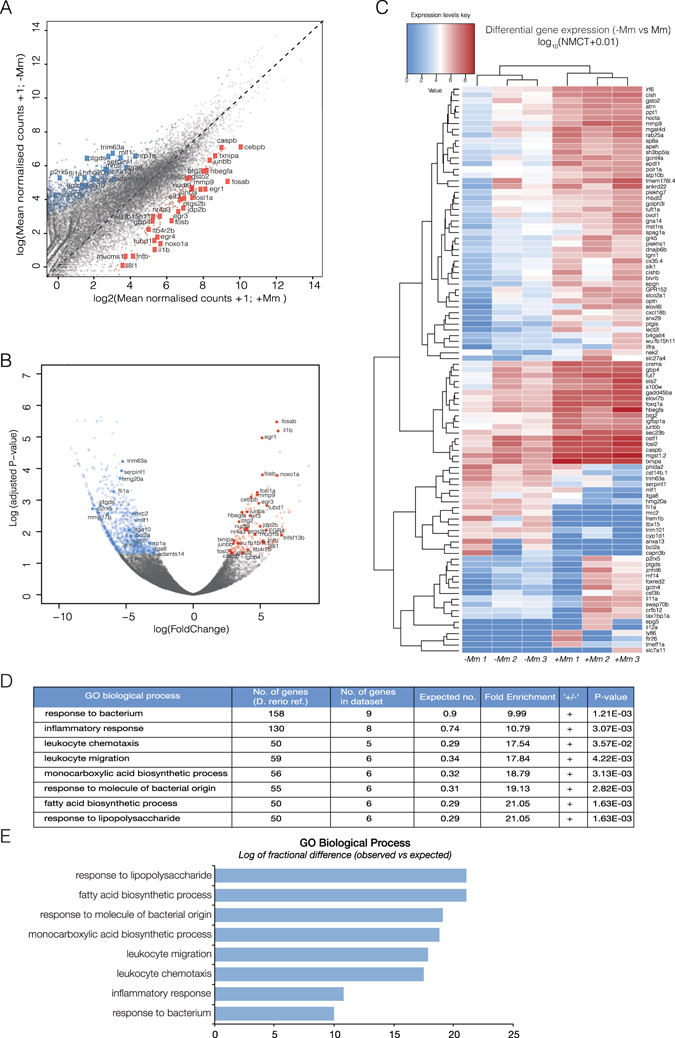
In vivo biotinylation of neutrophil nuclei and RNA-seq analysis reveal transcriptomic signature in response to M. marinum infection. (A) Scatterplot of log (Mean DESEq2 normalised counts (NMCT) +1) comparing M. marinum infected and uninfected controls show 189 upregulated genes (red) and 1100 downregulated genes (blue). (B) Volcano plot of DESEq2-generated differential expression analysis of embryos injected with M. marinum vs uninjected controls shows the relationship between p-value and log fold change (red-upregulated; blue-downregulated; grey-not significantly differentially expressed). (C) Heatmap shows the log10 (normalised counts (NMCT) +0.01) of selected differentially expressed transcripts (adjusted p-value < 0.05). Red - high expression. White - medium expression Blue - low expression. (D) Gene ontology enrichment analysis of upregulated genes following Mm infection. (E) Bar plot shows significantly overexpressed biological processes.