Figure 5.

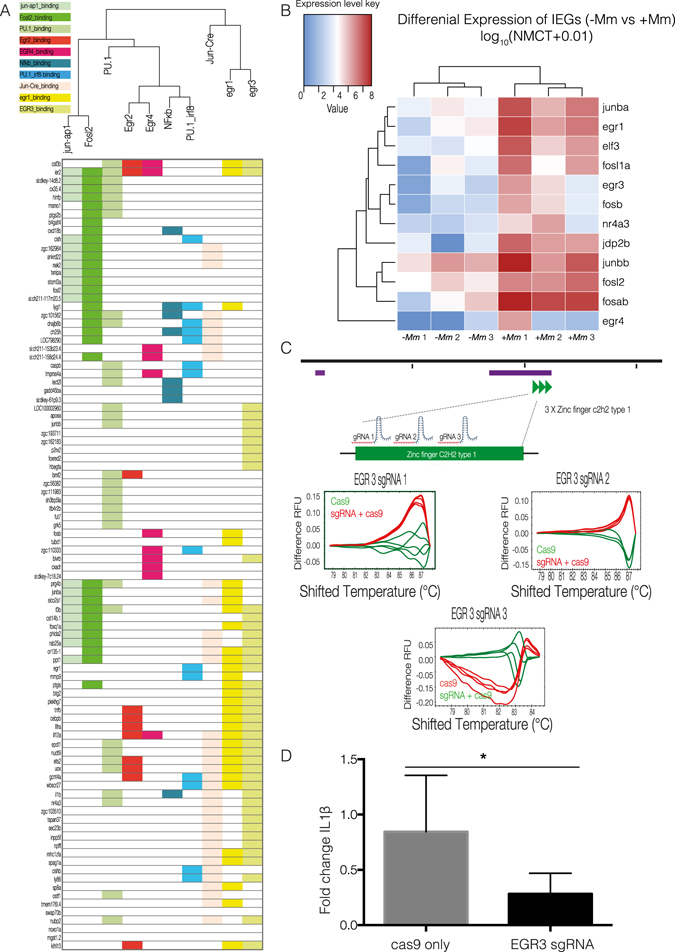
Analysis of transcription factors orchestrating neutrophil response to M. marinum. (A) Transcription factor motif search was performed on upregulated genes by de novo analysis using Homer. Dendrogram shows clustering of statistically significant transcription factors and upregulated genes with corresponding transcription factor binding sites highlighted below. (B) Heatmap shows the log10 (normalised counts (NMCT) +0.01) of selected differentially expressed transcripts for initial early response genes (IEGs) (adjusted p-value < 0.05). Red - high expression. White - medium expression Blue - low expression. (C) egr3 sgRNA tests for efficiency in inducing DNA double-strand breaks. sgRNAs were injected into the 1-cell stage and genomic DNA extracted at 24 hpf. High resolution melting curves from 3–4 individual embryos injected either with Cas9 mRNA only (green) or co-injected with Cas9 mRNA and egr3 sgRNA (red) are shown. (D) Bar graph representing il1β mRNA levels measured at 3 dpi by qPCR. Wildtype fish were co-injected with Cas9 mRNA and 3 sgRNAs for targeted knockout of egr3 or Cas9 mRNA only at the one cell stage, followed by injection of M. marinum at the 32–512 cell stage. Statistical significance was determined by two-tailed unpaired students t-test with Welch’s correction (*p < 0.05).
