
Figure 4.
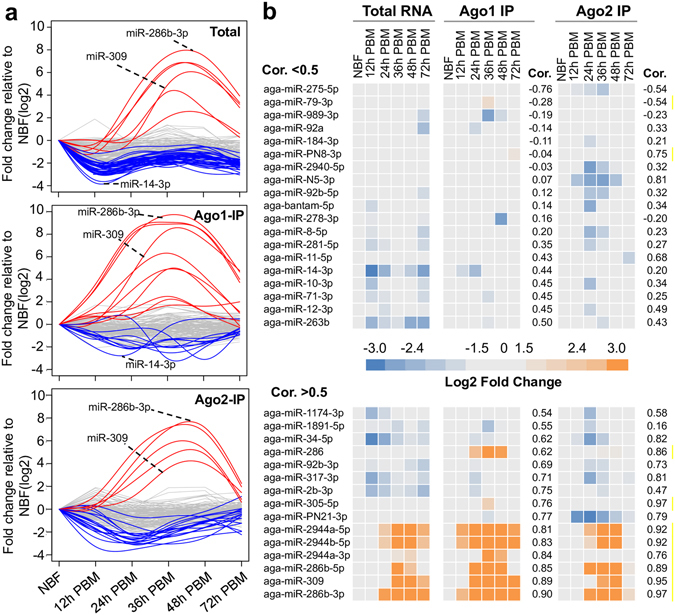
Expression and Ago integration of miRNAs after blood feeding in An. gambiae. (a) Changes in miRNA levels after blood feeding in terms of total small RNA, Ago1-IP RNA and Ago2-IP RNA. Each line represents one miRNA at six time points. Lines in red: upregulated miRNAs; lines in blue: downregulated miRNAs; lines in gray: miRNAs with no significant change. (b) Heatmap shows the log2-fold changes in miRNAs relative to the non-blood-fed controls. A Pearson correlation analysis were performed to assess the relationship between miRNA abundance in the total small RNA and in the Ago-IP RNA. Cor., Pearson correlation coefficient.