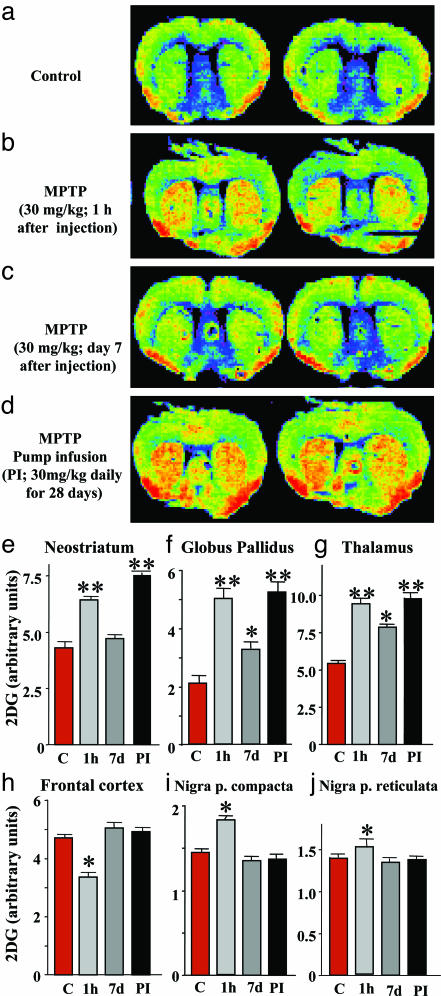
Fig. 1.
MPTP-induced activation of [14C]2-DG uptake. (a–d) False-color autoradiographs of brain sections from mice 1 h after injection with [14C]2-DG. 2-DG uptake was monitored in control mice (a), mice that were analyzed 1 h (b) or 7 days (c) after injections with a single dose of MPTP (30 mg/kg), and mice that were analyzed after 28 days of continuous MPTP infusion (30 mg/kg daily). (e–j) 2-DG uptake was quantified by film densitometry (n = 8–10 mice per group) in the neostriatum (e), globus pallidus (f), thalamus (g), frontal cortex (h), substantia nigra pars compacta (i), and substantia nigra pars reticulata (j). Asterisks indicate that the treated sample is significantly different (P < 0.05; ANOVA) from the controls (single asterisk) or from both the control and the MPTP-bolus injected sample 7 days after the injection (double asterisk). All data shown in this in all subsequent figures represent means ± SEMs.

