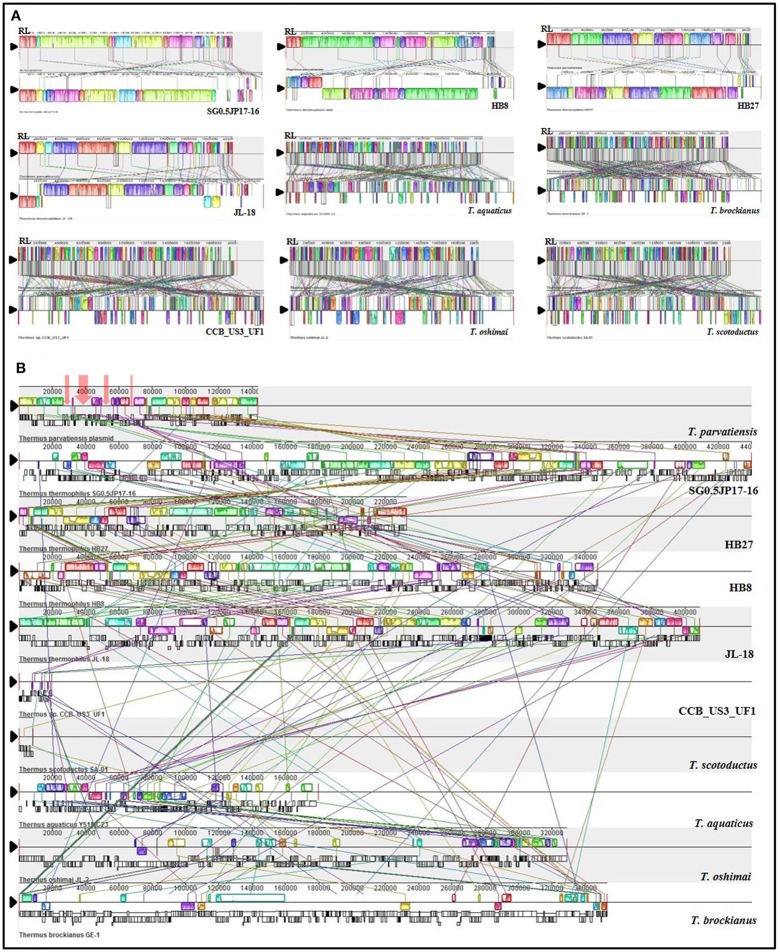
Figure 3.
Organizational (synteny) comparisons of T. parvatiensis with nine representatives of Thermus. Only members with complete genomes have been considered for this analysis. Synteny maps showing (A) comparison of the chromosome of T. parvatiensis against the chromosomes of other genomes; and (B) comparison of plasmid pTP143 against plasmid sequences (concatenated wherever number of plasmids >1) of other Thermus members. Boxes of different colors represent locally collinear blocks (LCBs) (or locally conserved regions) connected via lines of the same color to their corresponding positions on other genomes. For each genome, the LCBs above and below the reference line (indicated by black triangle) denote the orientation of the LCBs with respect to the reference sequence (LCBs below the black reference line denote inversions). Black lines (in B) below LCBs represent the position of coding sequences. Red arrows on plasmid pTP143 (in B) mark the regions that could not be mapped on other Thermus plasmids.

