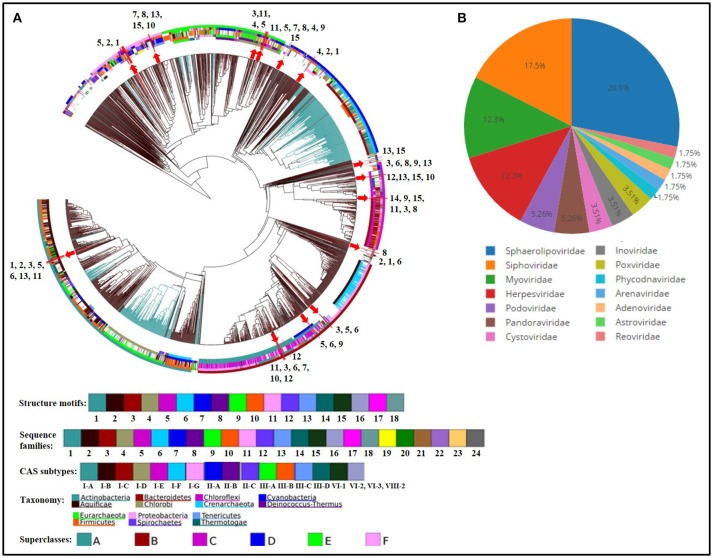
Figure 7.
CRISPR repeat (A) and spacer (B) analyses. (A) Dendrogram depicting clustering of CRISPR array repeats from all genomes of Thermus spp. against CRISPR repeats database (4,719 consensus repeats). The classification of repeats is based upon the division of all repeats into 24 conserved sequence families and 18 conserved structural motifs. The position of branches representing repeats from Thermus spp. is marked by red arrows and depicted by a number which corresponds to a genome, as follows: 1. T. aquaticus, 2. T. amyloliquefaciens, 3. T. brockianus, 4. T. caliditerrae, 5. Thermus sp. CCB_US3_UF1, 6. T. filiformis, 7. T. thermophilus HB8, 8. T. thermophilus HB27, 9. T. igniterrae, 10. T. thermophilus JL-18, 11. T. oshimai, 12. T. scotoductus, 13. T. tengchongensis, 14. T. parvatiensis, 15. T. thermophilus SG0.5JP17-16. Concentric circles are color coded and represent the following from inside out respectively: Structure motifs, sequence families, CAS subtypes, taxonomic groups, superclasses. Black and blue color branches represent bacterial and archaeal sequences respectively. (B) Pie diagram representing the relative abundance of viral families infecting Thermus genomes, predicted on the basis of CRISPR spacer analysis.

