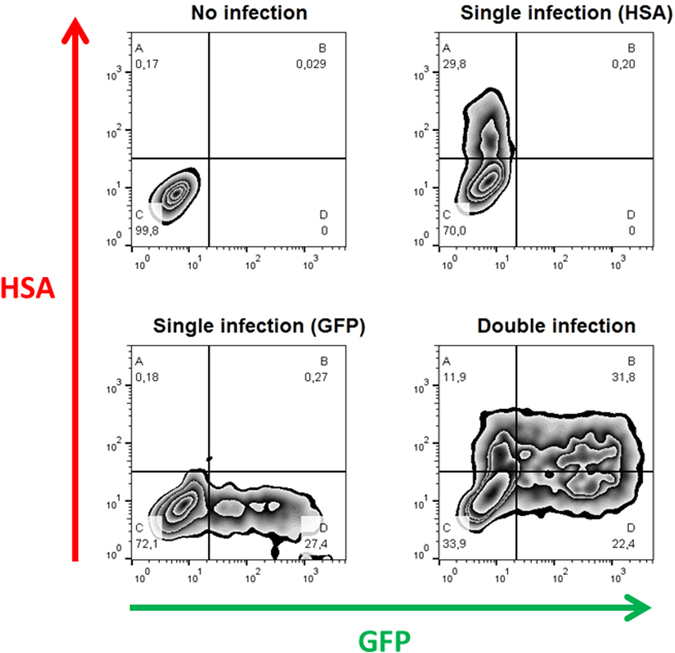
Figure 1.

Flow cytometry analysis of single and double HIV-1 infection. Panels represent the following conditions, clockwise starting from the upper left panel: no infection; infection by the HSA virus; coinfection with HSA and GFP viruses, infection by the GFP virus. In each panel, the quadrants correspond to HSA+ (A); HSA+GFP+ (B); uninfected cells (C); and GFP+ (D). The percentage of cells in each quadrant is indicated under the letter identifying the quadrant.
