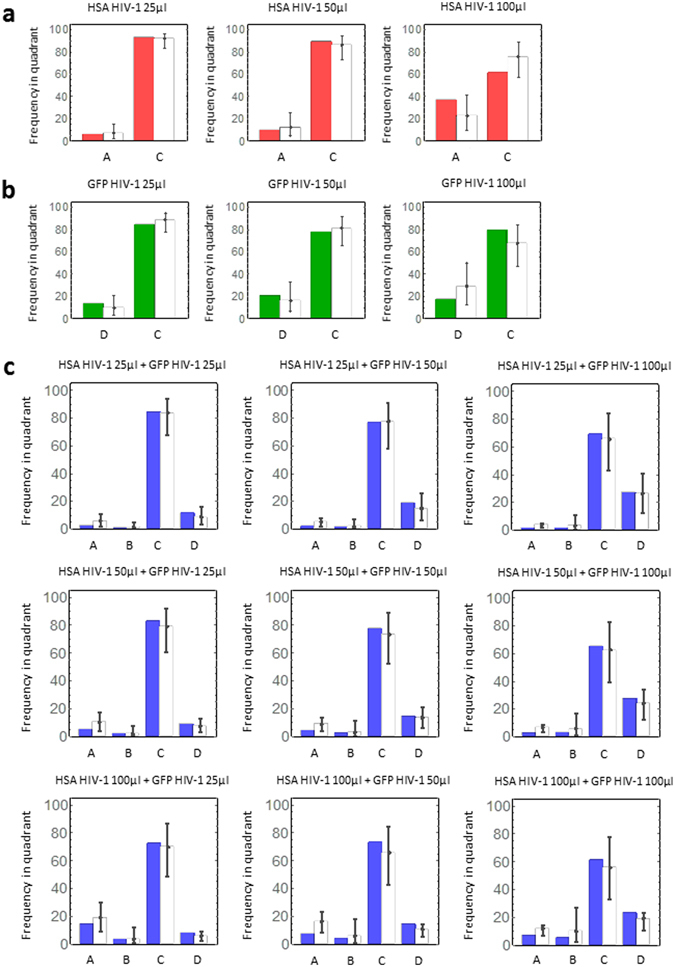
Figure 2.

Frequency of single infection and coinfection: (a) The experimental and theoretical frequencies of quadrants A (i.e., HSA-positive) and C (i.e., HSA-negative) in three independent experiments using only HSA HIV-1 are shown by red and white bars, respectively. (b) The experimental and theoretical frequencies of quadrants D (i.e., GFP-positive) and C (i.e., GFP-negative) in single GFP HIV-1 experiments are shown by green and white bars, respectively. (c) The experimental and theoretical frequencies of quadrants A (i.e., HSA-positive), B (i.e., positive both for HSA and GFP), C (i.e., negative both for HSA and GFP), and D (i.e., GFP-positive) in double HIV-1 experiments are shown by blue and white bars, respectively. Two independent experiments were run with the nine indicated combinations of HSA and GFP HIV-1 corresponding to all possible combinations of the three different amounts of each virus used in single experiments. Note that each error bar represents the 95% credible interval obtained from Markov Chain Monte Carlo (MCMC) parameter inferences (Table 1).
