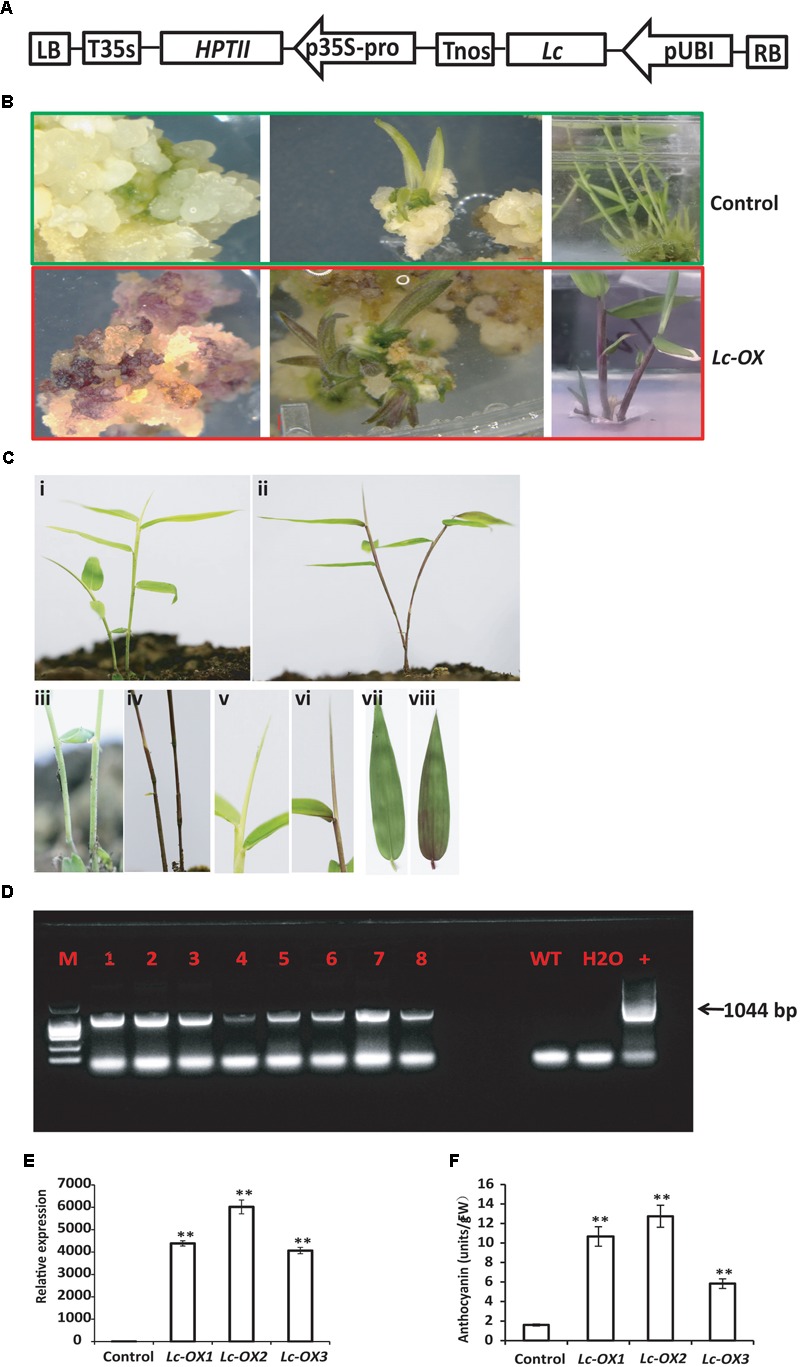
FIGURE 4.

Overexpression of the maize Lc gene in Ma bamboo leads to the increased accumulation of anthocyanin. (A) Schematic representation of the putative inserted T-DNA region. The expression of maize Lc gene was controlled by ubiquitin promoter (pUBI), and HPTII gene driven by 35S promoter confers plant with hygromycin resistance. (B) Phenotypes of Lc-gene heterogonous expression lines during tissue culture. Purple pigment accumulation in the callus (left), regenerated shoot (middle and right panels) in the transgenic line (lower panel) compared with control (up panel). (C) Phenotype of Lc-gene heterogonous expression lines grown in the soil. Represented transgenic lines (ii) exhibit purple color compared with control (i). The enlarged picture of stem (iv), leaf blade (vi), and leaf (viii) and their corresponding controls (i,iii,v,vii, respectively) were shown. (D) PCR analysis of the transgenic lines. The expected 1044 bp product was detected with genomic DNA from putative transgenic bamboo as template. (E) qRT-PCR analysis of Lc-gene heterogonous expression lines. Total RNA was extracted from control and three represented transgenic lines (Lc-ox1, Lc-ox2, and Lc-ox3), and the qRT-PCR was performed using Lc gene specific primers. The Actin gene of Ma bamboo was used as internal control. The data shown represent mean values and standard errors obtained from at least two independent experiments with four technical repeats. ∗∗ indicates significant differences in comparison to control at p < 0.01 (Student’s t-test). (F) Quantitative measurement of anthocyanins in 1-month-old seedlings of the control and three represented Lc-gene heterogonous expression lines. The data was shown as means and SD of three replicates. ∗∗ indicates significant differences in comparison to control at p < 0.01 (Student’s t-test).
