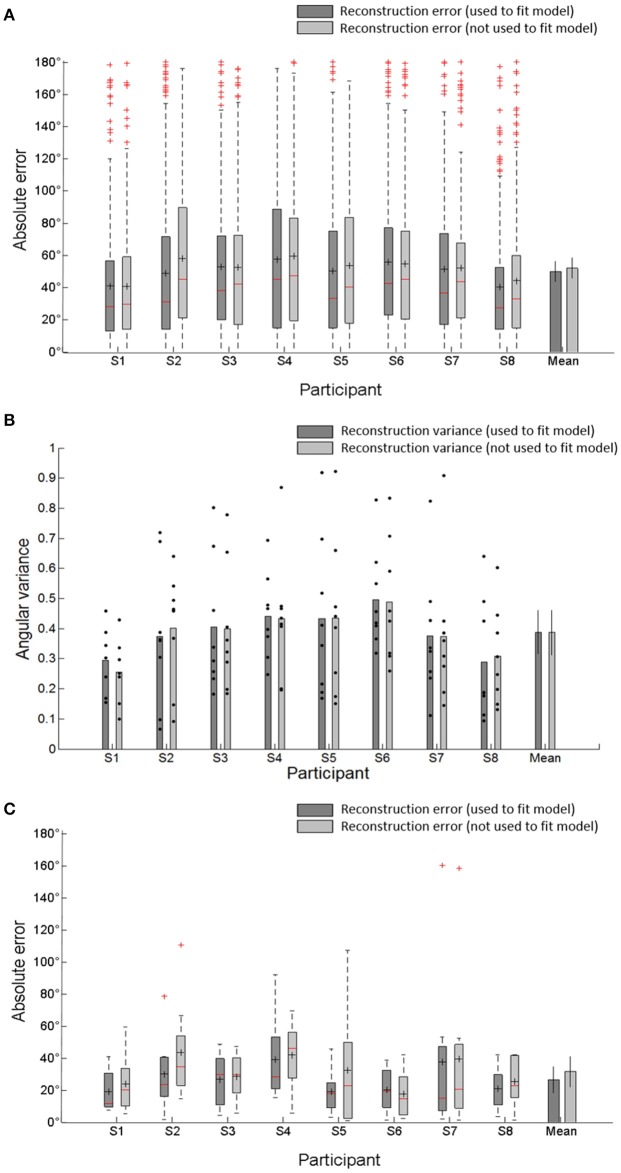
Figure 6.
(A) Absolute error between the reconstructed directions and the target directions by combining all reconstructed directions in each subject. It represents the distribution of reconstructed direction errors in each subject. The central reds line in central boxes indicate the median of the reconstruction errors. Black + in the central box indicate the mean of reconstruction's absolute errors (MAE). The central box represents the central 50% of the absolute errors. Its lower and upper boundary lines are at the 25%/75% quantile of the errors. Vertical lines from the central box indicate the remaining data outside the central box except outliers (red +). Bar plot indicates average MAE and SD across all participants. (B) Angular variance (AV) of reconstructed directions. Black dots indicated angular variance of each target directions which was used to reconstruct movement directions. The error bars in averaged variance (mean) indicate the SDs across participants. (C) Absolute error between mean angular directions obtained by averaging all reconstructed directions and target directions in each subject and the average MAE and SD across all participants.

