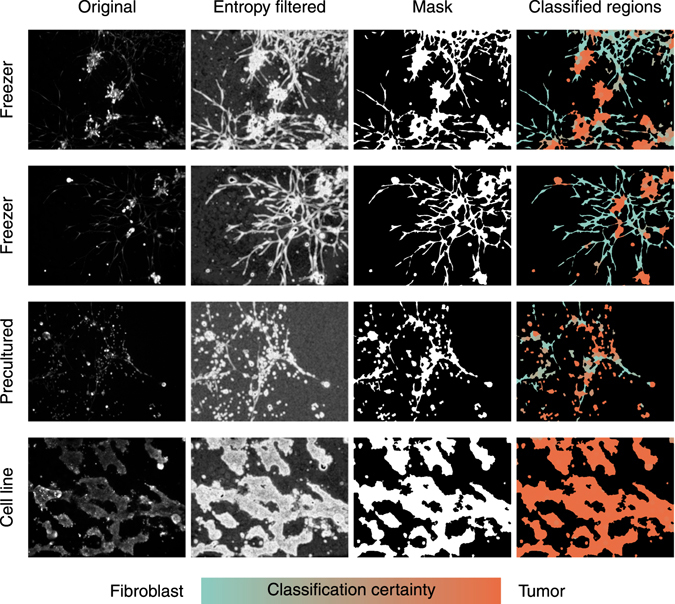
Figure 4.

The suggested segmentation sequence and subsequent steps enable classification of different cell types in confocal images from PDX microtissue cultures. The original calcein-labeled live cell images, consisting of multicellular tumor organoids and fibroblasts were first local entropy filtered. Next, their foreground was separated from the background to obtain the segmentation masks. These masks were then split into individual regions that were subsequently classified into the two main cell types trained for. These were shown with distinct colors (Tumor cells: orange, CAFs/Fibroblast: blue). The color shading indicates the certainty of the classification. Cultures started directly from frozen cultures, from pre-cultured cells or by the use of cell lines, illustrate the impact of controlling the amount of fibroblasts included into 3D cultures. These example images were not part of the ground truth training set.
