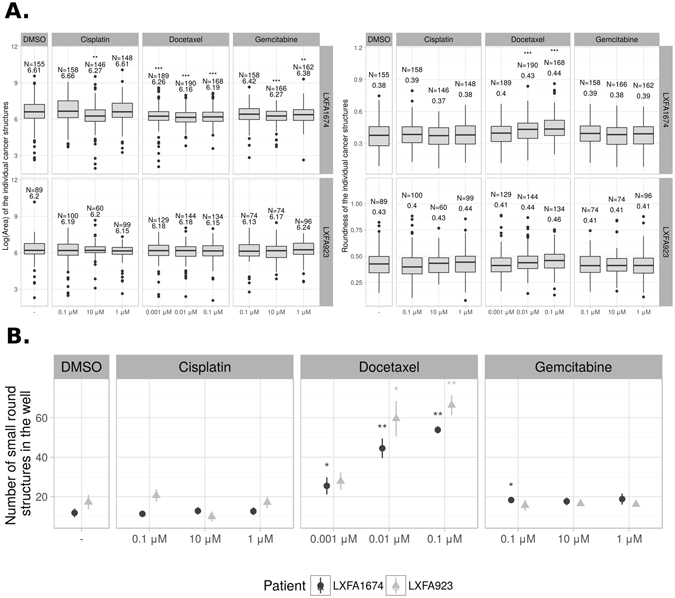
Figure 8.

Morphometric analysis of tumor organoids. (A) The distributions of area and roundness of the tumor organoids, treated with standard-of-care drugs. Two patient-derived xenograft samples, LXFA 1647 and LXFA 923, were treated with standard-of-care drugs, cisplatin, docetaxel and gemcitabine in three different concentrations. Only tumor organoids were included and single rounded, dying cells were excluded from the analysis. The stars denote the p-value of the robust Van den Waerden test63 against the DMSO control: *p < 0.05, **p < 0.01, ***p < 0.001. The sample size and the median value are displayed on top of the graphs. (B) Quantification of single, rounded cells that indicate cell death, across drug treatments. Mean and its standard error are shown. The stars denote the p-value of the robust Van den Waerden test63 against the DMSO control. Sample size in each group is 6.
