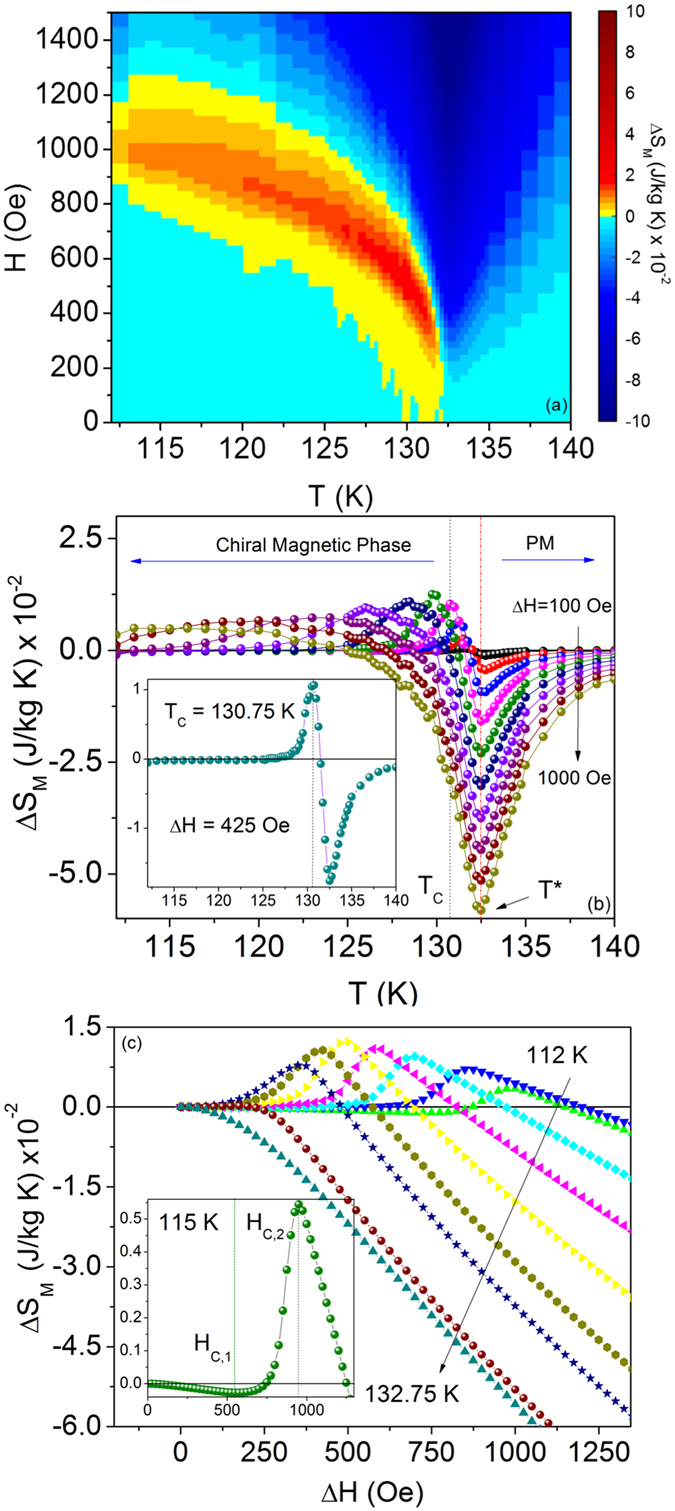
Figure 3.

Magnetic entropy change as a function of temperature and field. (a) H − T surface plot of ΔS M. (b) ΔS M vs. T for ΔH = 100–1,000 Oe, which shows the behavior of the chiral and PM phases. For clarity, ΔS M(T) is shown in steps of ΔH = 100 Oe. A temperature gap, ΔT, exists between T C and the order-disorder transition at T*. Inset: ΔS M vs. T for ΔH = H C(T C). (c) ΔS M vs. ΔH for temperatures below and above T*. Inset: ΔS M at 115 K which shows the peak, H C,2, above which ΔS M monotonically decreases with H, defined as the IC-C transition. The local minimum at H C,1 defines the CHM−CSL crossover.
