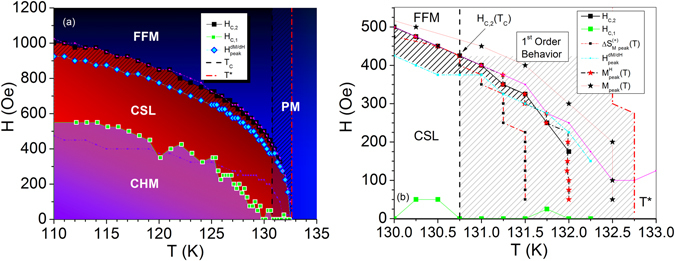
Figure 6.

H-T phase diagram from ΔS M(T,H) and magnetization data. (a) ΔT is indicated by the shaded region between T C and T*. The hashed area between H C,2 and H peak defines the highly nonlinear CSL. The nonlinear CSL is bounded from above by H peak and from below by H C,1 and H Arr,1. H C,1 and H Arr,1 (purple line) form a pocket within the chiral phase of the linear CSL. H Arr,2 (pink line) corresponds exactly to H C,2. (b) H-T phase diagram in the ΔT region where first-order behavior exists. The phase line for onset of CSL is a steep boundary at 132 K, indicated by red stars, where a first-order transition may exist. Irreversibility in this region can be seen by comparing M vs. T peaks measured with a ZFC protocol (black stars) and M vs. T peaks reformulated from M vs. H:M H(T) (red stars).
