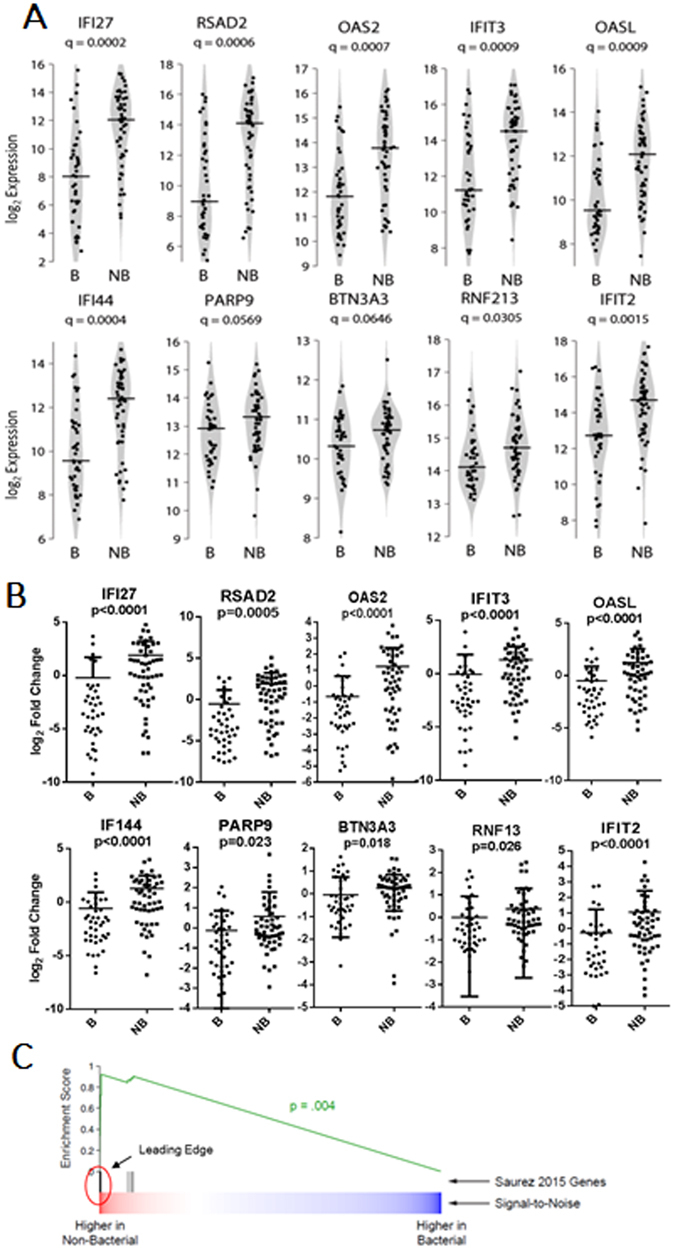
Figure 1.

Replication of Array-Based Predictors. (A) Violin plots of RNASeq-based expression data for each of the 10 genes. Q-values for differential expression between bacterial and non-bacterial groups are indicated beneath the gene names. Horizontal lines indicate group medians. (B) Quantitative reverse transcriptase-polymerase chain reaction (qPCR)- based expression data for each of the 10 genes. P-values for differential expression between bacterial and non-bacterial groups are indicated beneath the gene names. Horizontal lines indicate group medians. (C) Gene set enrichment analysis plot for these 10 genes. Seven genes (vertical black lines) are contained in the leading edge of the enrichment plot.
