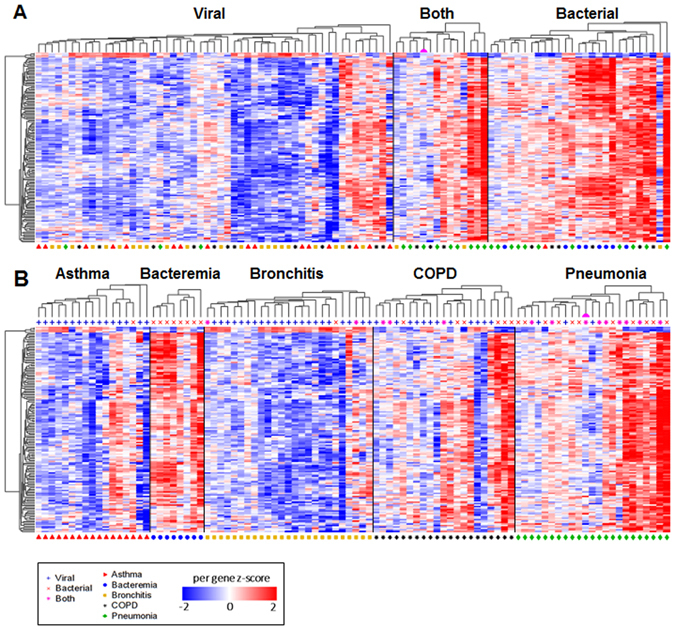
Figure 2.

Global Expression Patterns in LRTI. (A) Shown is a heat map for the 141 genes (rows) demonstrating significantly different expression levels between bacterial and non-bacterial groups. Each column represents an individual subject, and subjects were grouped based upon microbiological diagnosis, using independent hierarchical clustering (Euclidean distance with average linkage). (B) The same data are presented, grouped by clinical diagnosis. The pink semi-circle denotes the patient with influenza A and a single blood culture positive for S. aureus.
