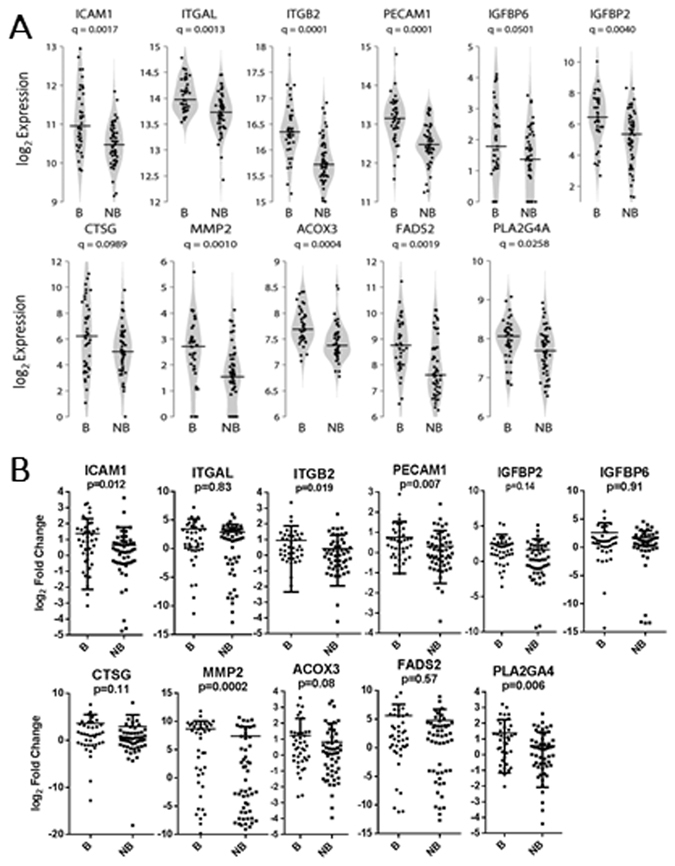
Figure 3.

Expression of Genes Predictive for Bacterial Involvement in LRTI. (A) Violin plots of RNASeq-based expression data for 11 selected genes, from 3 canonical pathways, that provide predictive value for identifying bacterial involvement in lower respiratory track infections. Q-values for differential expression between bacterial and non-bacterial groups are indicated beneath the gene names. Horizontal lines indicate group medians. (B) Quantitative reverse transcriptase-polymerase chain reaction (qPCR)- based expression data for each of the 11 genes. P-values for differential expression between bacterial and non-bacterial groups are indicated beneath the gene names. Horizontal lines indicate group medians.
