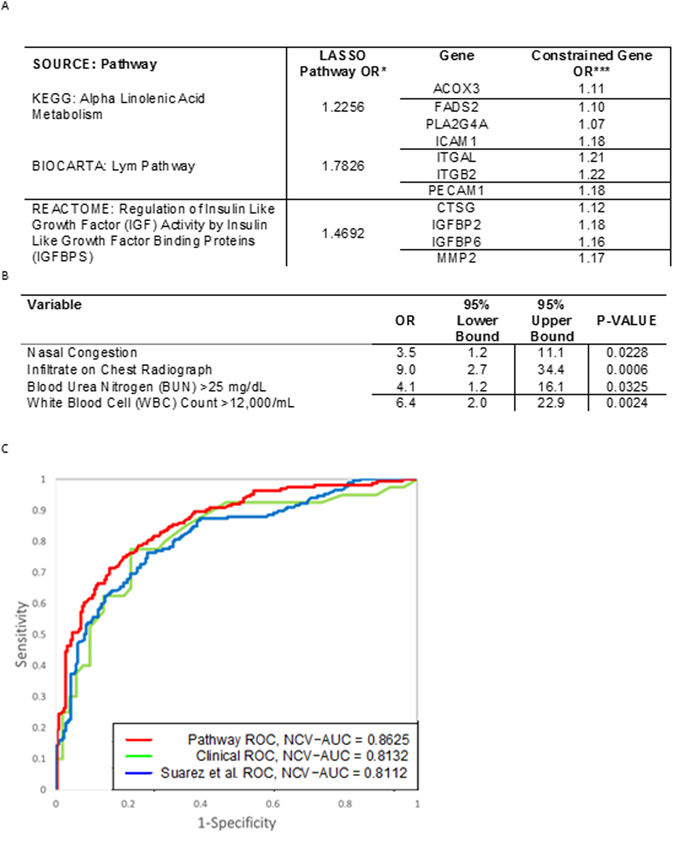
Figure 5.

Comparison of Predictive Performance for Gene Expression and Clinical Biomarkers. (A) LASSO-penalized logistic regression retained 3 pathways consisting of a total of 11 genes providing the greatest predictive value for classifying subjects as bacterial or non-bacterial. *LASSO Pathway OR are odds ratios per SD of the hard-thresholded 1st PC of the nominally significant genes within the pathway. ***Constrained Gene OR = exp (Gene Loading * log (LASSO Pathway OR)/SDPathway) = (LASSO Pathway OR)(Gene Loading/(SD of Pathway)). (B) Cross-validation chose a 4-predictor model consisting of nasal congestion, infiltrates on chest radiograph, blood urea nitrogen levels and white blood cell count. (C) Area Under the ROC Curve (AUC) characteristics are shown for fully nested cross-validated estimates using the “pathway”-selected 11 gene set, the “array”-selected 10 gene set, and the 4 clinical variables. These data indicate that our pathway-based 11-gene predictor outperforms both the clinical and array-based gene models.
