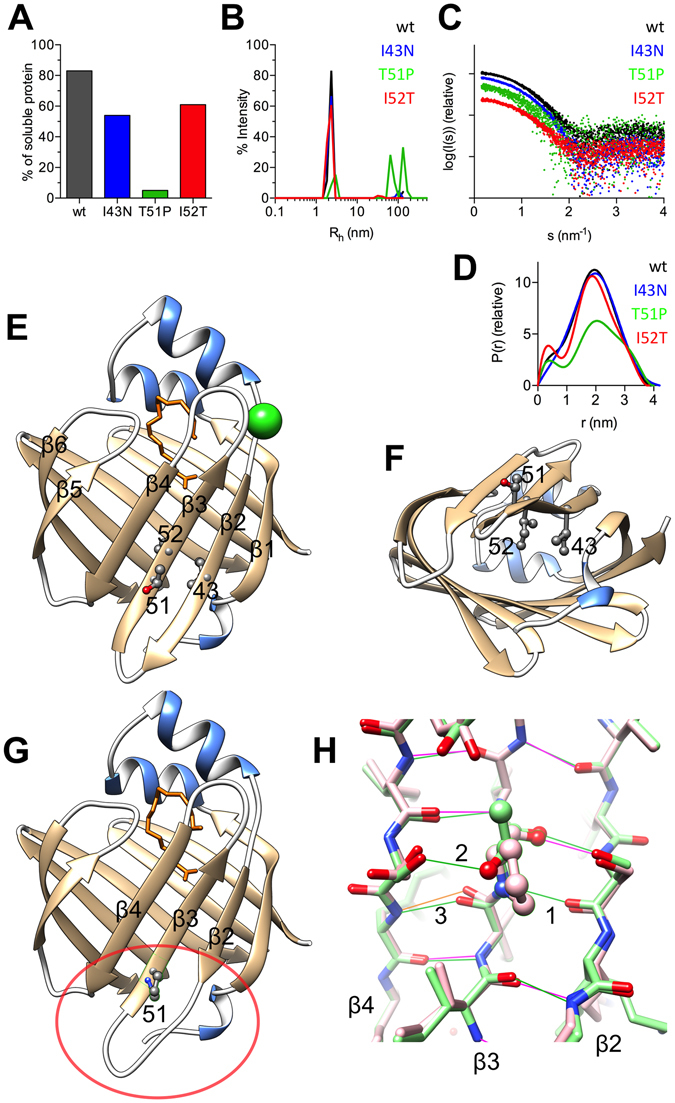
Figure 1.

Structure and stability of P2. (A) Solubility analysis. (B) Dynamic light scattering indicates aggregation of T51P. Note that the curves for P2wt and I43N nearly overlap in panels B and D. (C) The SAXS scattering curve. (D) Distance distribution functions. (E) Crystal structure of P2 with the mutant positions labelled. The bound fatty acid is shown in orange and the anion binding site with a chloride ion (green). (F) The mutation hot spot viewed from the bottom. (G) The crystal structure of T51P. Note the decreased area of the β sheet close to the mutation; compare the circled area with the corresponding area in panel E. (H) Hydrogen bonds near residue 51 in wild-type (green) and T51P (pink); the shown region corresponds to the circled area in panel G. Three hydrogen bonds are labeled: 1) main-chain H bond that is lost in the mutant protein, 2) side-chain hydrogen bond lost in the mutant protein, 3) main-chain H bond that is in an unfavorable conformation in the mutant protein (orange).
