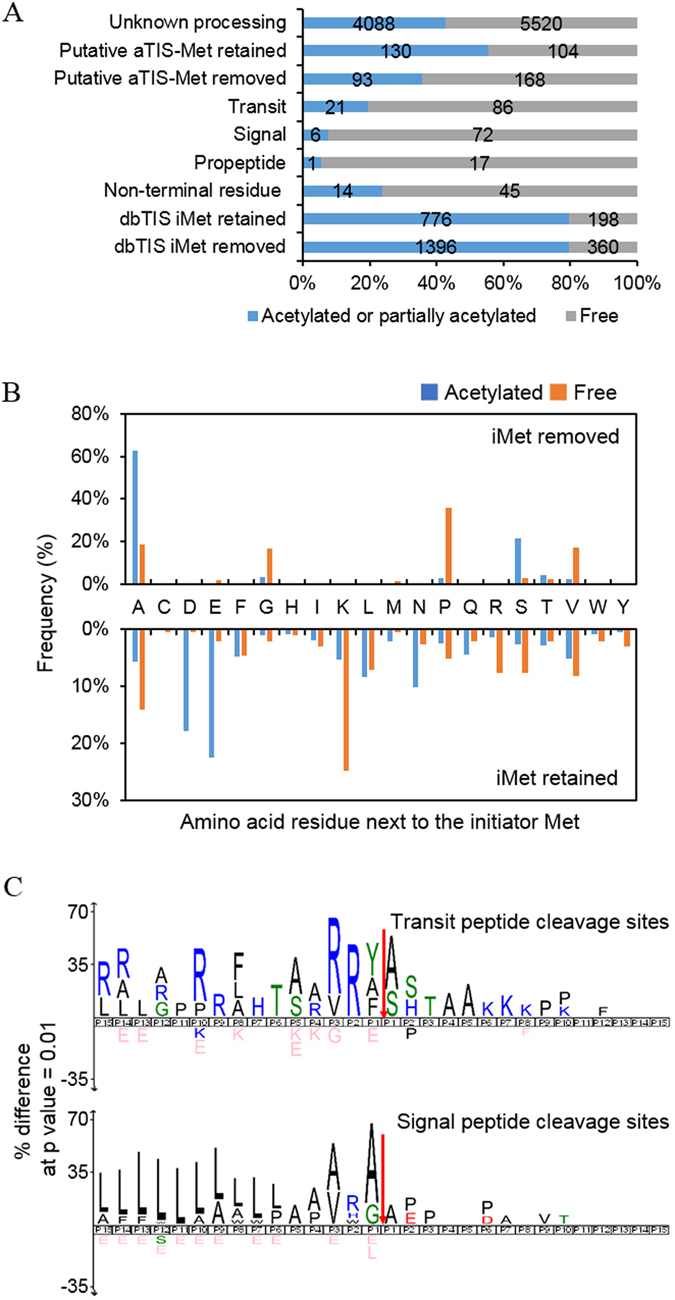
Figure 4.

Features of protein N-termini. (A) Distribution of acetylated N-termini and free N-termini according to the type of N-termini. The data are presented in percentage values, and the exact numbers of protein-N-termini are denoted within bars. (B) The amino acid frequency at the second residue of acetylated or free protein N-termini. ‘The second residue’ means the residue next to the initiator methionine. (C) The amino acid frequency at the flanking region of signal peptides and transit peptides. The protein sequence logos were generated using the iceLogo software package with correction for natural amino acid abundance. The red arrows indicate observed cleavage sites.
