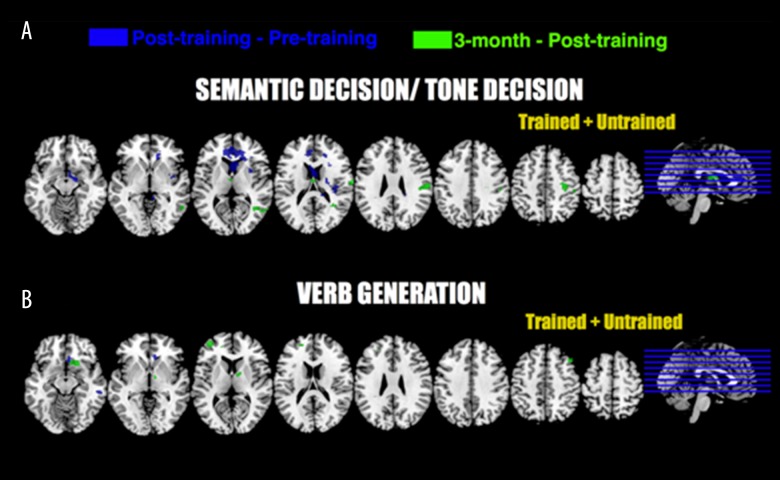
Figure 5.
Functional MRI tasks results of regression analyses with BNT (p<0.01; 50 contiguous voxels). Functional difference over time for each task is regressed with difference in BNT score over time. Peak coordinates are provided in Table 7. All pictures are in neurological convention.

