
Figure 2.
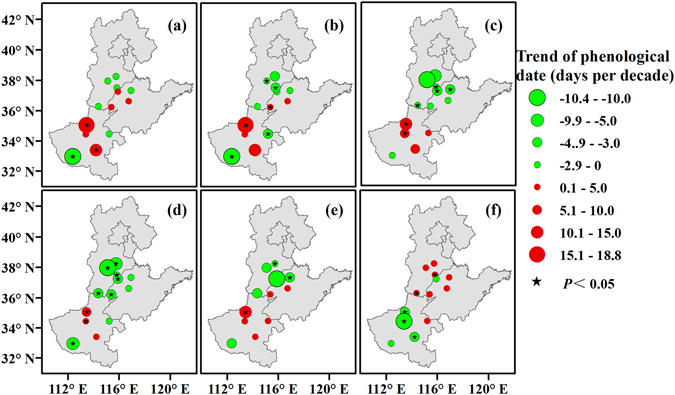
Spatiotemporal changes in the cotton sowing (a), emergence (b), squaring (c), flowering (d), boll opening (e), and harvest (f) dates across the North China Plain from 1981 to 2012. Green and red circles represent the trends of the phenological date. Black pentagrams represent the trends at the stations, with a significance level of 0.05. Maps were generated using ArcGIS 10.1 (ESRI Inc, Redlands, CA, USA, http://www.esri.com/).