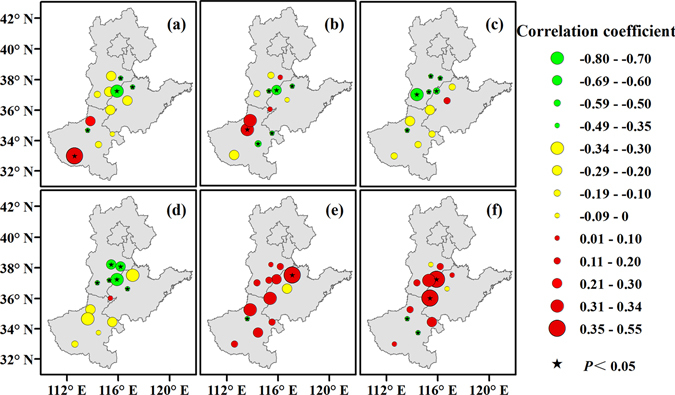
Figure 5.

Correlation between Tmean and the lengths of the sowing-emergence (a), emergence-squaring (b), squaring-flowering (c), flowering-boll opening (d), and boll opening-harvest (e) periods and the whole growing period (f) of cotton across the North China Plain from 1981 to 2012. Green, yellow, and red circles represent the correlation coefficient. Black pentagrams represent a significance level of 0.05. Maps were generated using ArcGIS 10.1 (ESRI Inc, Redlands, CA, USA, http://www.esri.com/).
