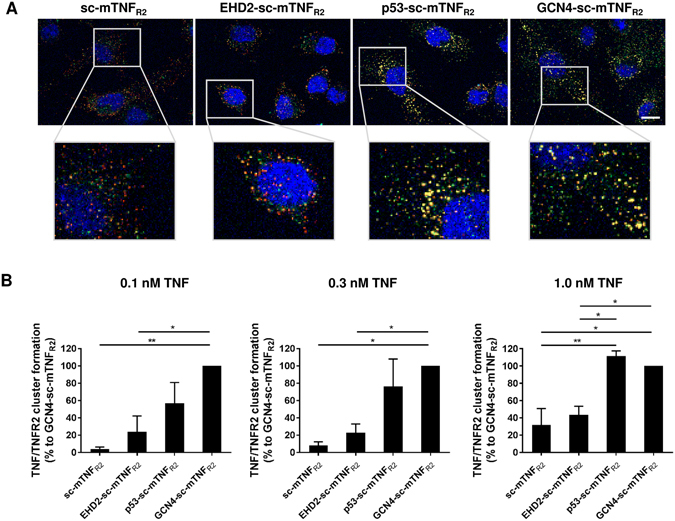
Figure 4.

Dodecameric TNF muteins exert elevated TNF/TNFR2 cluster formation (A) BV-2 cells were incubated with the oligomerized TNF muteins (0.1, 0.3, 1.0 nM) for 15 minutes. Then cells were fixed and localization of TNFR2 (red) and oligomerized TNF muteins (green) was visualized by immunofluorescence microscopy. DAPI was used to counterstain cell nuclei. Fluorescence was analyzed using a Zeiss Axio Observer Spinning Disc microscope. Representative pictures for stimulation with 1 nM of the oligomerized TNF muteins are shown. Scale bar: 10 µm. (B) Quantification of TNF/TNFR2 clustering (n = 3 ± SEM).
