Figure 1.

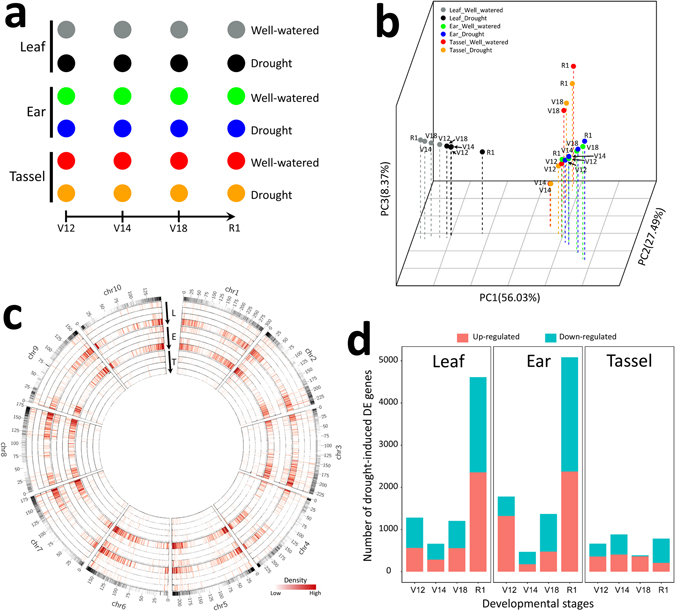
Drought treatment caused dynamic changes in maize growth: generation of a spatio-temporal gene expression map of the response. (a) Time-lapse procedure of maize sample treatment. (b) Principal component analysis of the different samples comprising the spatio-temporal map of drought response. (c) Density of differentially expressed (DE) genes of the drought stress response. Outer track shows density of total DE genes. Arrows indicate the four developmental stages from V12 to R1 in the three tissues, respectively. L, leaf; E, ear; T, tassel. (d) Number of genes that showed differential expression at four developmental stages and in three tissues after drought treatment.
