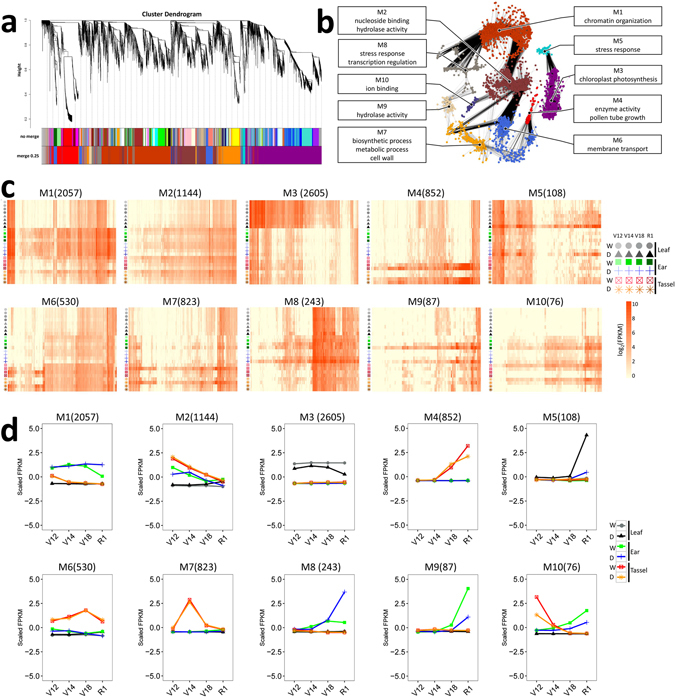
Figure 2.

Co-expression network analysis identifying gene modules underlying drought stress at four developmental stages in three tissues. (a) Hierarchical cluster dendrogram showing co-expression modules identified using weighted gene co-expression network analysis (WGCNA) of the differentially expressed genes. Modules corresponding to branches are labelled with colours indicated by the colour bands underneath the tree. With 0.25 threshold merging, 10 modules were generated. (b) Connection network among the 10 modules. Nodes are colour-coded by module. The over-represented gene ontology (GO) terms for each module are shown. (c) Heatmap showing gene expression levels of the genes within the 10 modules in three tissues across four developmental stages. W, well-watered; D, drought. (d) Changes in expression of the genes within the 10 modules over the course of development in three tissues. W, well-watered; D, drought.
