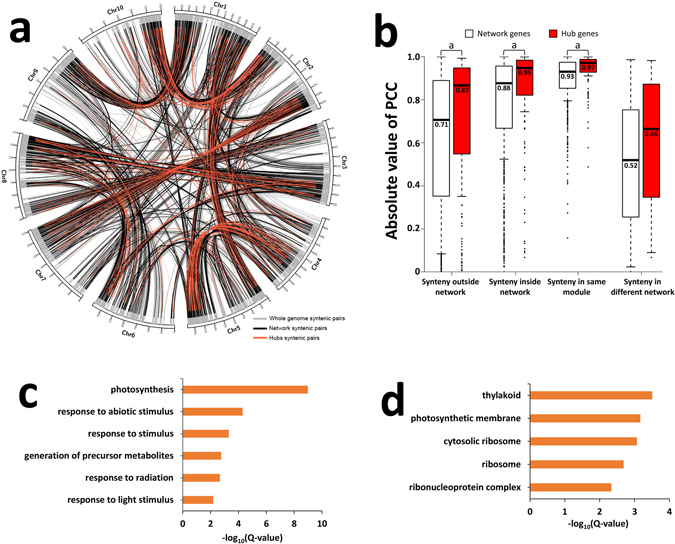
Figure 4.

Syntenic analysis of hub genes revealed evolutionary biases for drought adaptation in maize. (a) Distribution of genome-wide syntenic gene pairs. Grey indicates whole-genome syntenic pairs. Black indicates syntenic pairs in the same network. Red indicates syntenic hub gene pairs. (b) Comparison of Pearson’s correlation coefficient (PCC) values between syntenic genes in network sets and hub sets. The statistical analysis was conducted between each set of network pairs and hub pairs by Student’s t-test. a, P < 0.01. (c) Gene ontology enrichment for conserved hub genes. (d) Gene ontology enrichment for diverged hub genes.
