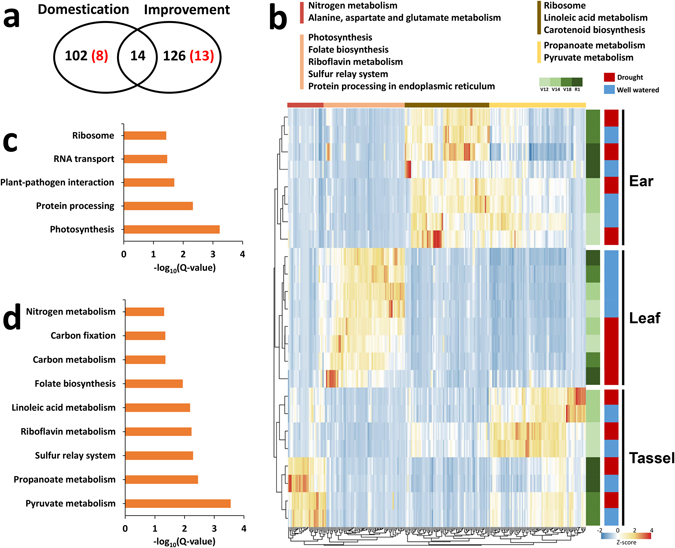
Figure 5.

Evidence for maize-specific domestication and improvement. (a) Numbers of domestication genes and improvement genes and their overlap. Red numbers in parentheses indicate hub genes. (b) Heatmap comparing scaled expression values of domestication and improvement genes at four developmental stages in three tissues. Top colour bars indicate pathway enrichment (Q < 0.05) for tissue-specific gene sets. (c) Gene ontology enrichment for domestication genes. (d) Gene ontology enrichment for improvement genes.
