
Figure 6.
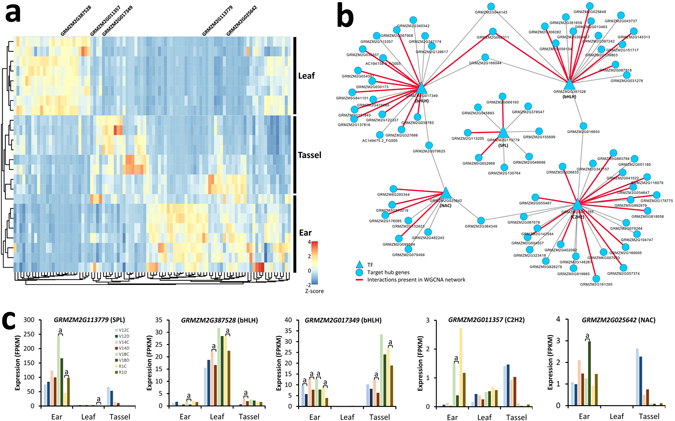
Dynamic changes in the transcriptional regulatory network in response to drought stress. (a) Heatmap comparing scaled expression values of 94 differentially expressed transcription factors (TFs) at four developmental stages in three tissues. The genes listed on the right (GRMZM2G025642, GRMZM2G011357, GRMZM2G387528, GRMZM2G113779 and GRMZM2G017349) encode five network TFs with over-represented targets. (b) Topology of five TFs possessing over-represented targets in the network. TFs are represented as triangles and targets are represented as ellipses. Red colour indicates targets included in the network. Blue colour indicates targets outside of the network. (c) Expression profiles of GRMZM2G025642, GRMZM2G011357, GRMZM2G387528, GRMZM2G113779 and GRMZM2G017349 at four developmental stages in three tissues. a, Adjusted P-value ≤ 0.05.