
Figure 1.
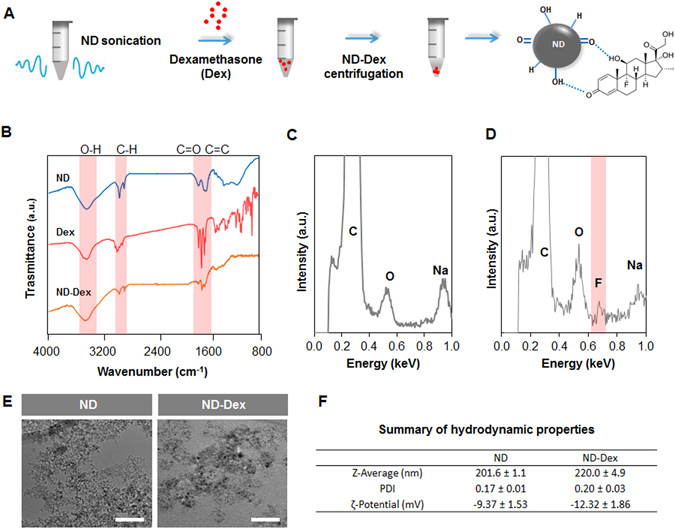
Preparation and characterization of the ND-Dex complex. (A) Schematic describing the steps necessary to prepare the ND-Dex complex and the possible interactions between the drug and the ND surface. (B) FT-IR spectra in the range of 4000 to 800 cm−1 of ND, Dex, and the complex. Highlighted in red are the characteristics FT-IR peaks defining the main functional groups involved in the complex formation. (C) The EDX spectra of ND showed the presence mainly of carbon and oxygen on the NDs surface. (D) EDX spectra of the ND-Dex conjugate indicating the presence of fluorine on the surface of ND, thus confirming the adsorption of Dex on the NDs surface (E) TEM images of ND and ND-Dex complex suspensions in water (Scale bar = 50 nm). (F) Comparison of the hydrodynamic properties of ND and the ND-Dex complex in ultrapure water. Data are expressed as mean ± S.D. (n = 3).