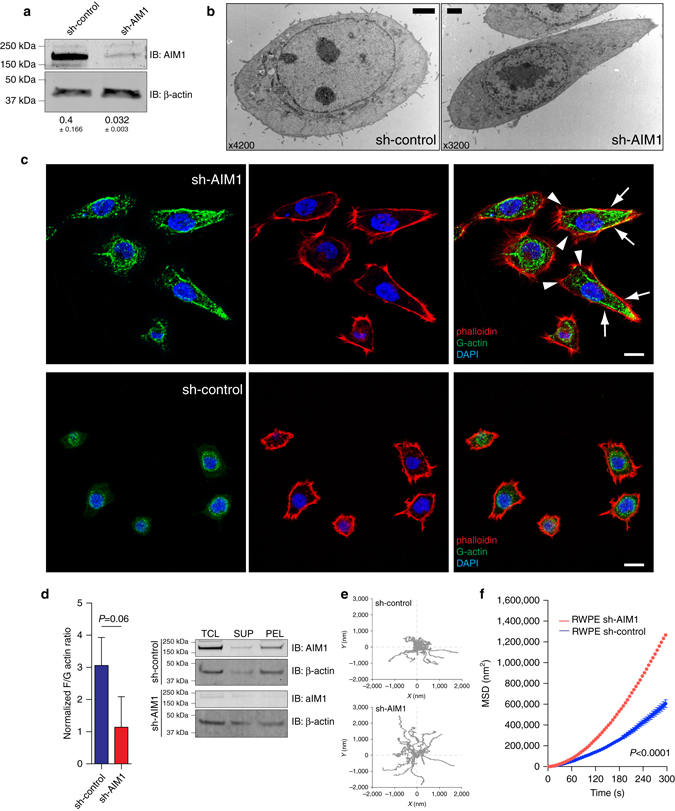
Fig. 3.

AIM1 depletion results in increased formation of cell protrusions and enhanced cytoskeletal remodeling. a Western blot confirming AIM1 knockdown in sh-AIM1 cells. Numbers below blots show normalized AIM1 intensities (±SD) from three independent experiments. b Electron microscopic ultrastructural analyses reveal increased cell size and formation of broad cell protrusions at the leading edge in RWPE-1 cells depleted of AIM1. Scale bar indicates 2 μm. c Immunofluorescence microscopy using probes specific to F-actin (AlexaFluor-labeled phalloidin, red) and G-actin (monoclonal G-actin-specific antibody, green 21) in AIM1 proficient and deficient RWPE-1 cells further corroborate the increased size and cell protrusion formation phenotype in sh-AIM1 cells and demonstrate an increased accumulation of G-actin in the trailing edge of sh-AIM1 cells (arrowheads indicate broad cell protrusions at the leading edge, arrows indicate trailing edge). Scale bar indicates 10 μm. d Biochemical fractionation of G-actin and F-actin by differential centrifugation reveals increased abundance of G-actin in sh-AIM1 cells. PEL pellet after ultracentrifugation (containing F-actin pool), SUP supernatant after ultracentrifugation (containing G-actin pool), TCL total cell lysate. Left panel shows densitometric quantification of three independent biochemical fractionation experiments, representing the mean ± SD. e Representative bead trajectory plots for sh-control and sh-AIM1 cells selected from three independent experiments. f Mean-squared displacements (MSD) of nanoscale bead motion analysis in RWPE-1 sh-AIM1 and sh-control cells shows substantially increased nanoscale motion suggestive of increased cytoskeletal remodeling in RWPE-1 sh-AIM1 cells (P < 0.0001) (t-test P values)
