Fig. 7.

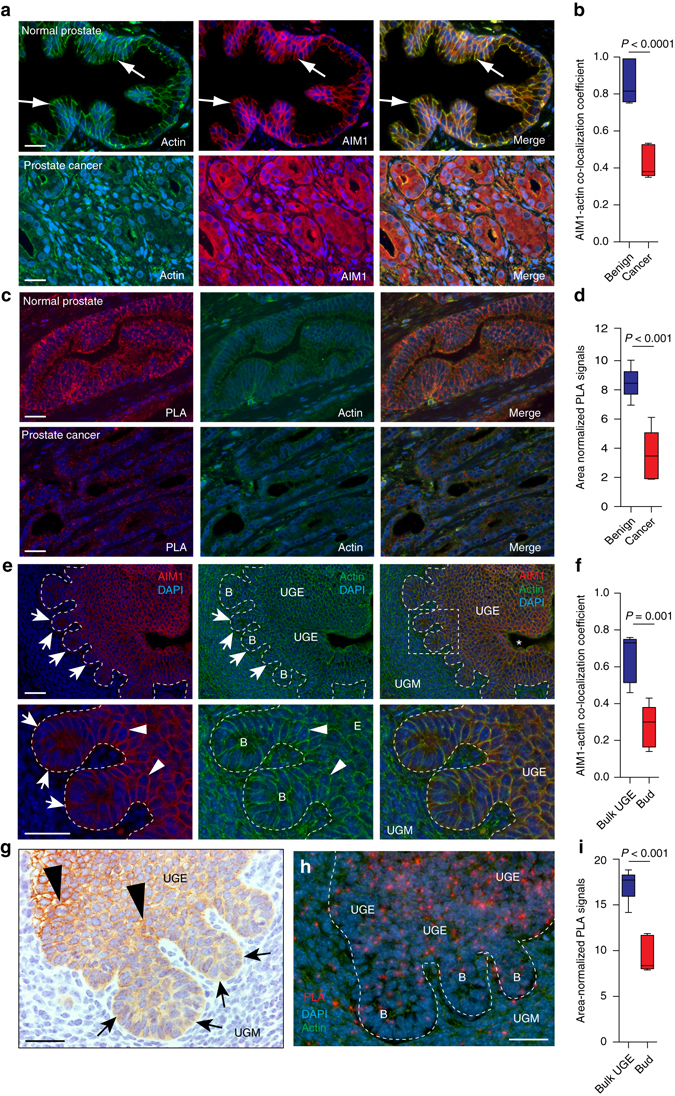
AIM1 and actin localization in normal prostate, prostate adenocarcinoma and prostate embryonic development. a Co-immunolabeling of AIM1 (red) and β-actin (green) reveals high degree of co-localization in normal prostate epithelium. In prostate cancer, this co-localization is largely abolished and AIM1 shows a diffuse cytoplasmic staining pattern. Nuclei are counterstained with DAPI. b Boxplot shows distribution of co-localization coefficients of AIM1 and β-actin immunostaining in prostate cancer and adjacent benign prostate epithelium (n = 8 cases). Scale bars indicate 50 μm. c Proximity ligation assays (PLA) confirm close spatial proximity of AIM1 and β-actin in benign prostate epithelial cells and greatly reduced interaction in invasive carcinoma. Red dots indicate discrete interaction signals by PLA; green shows β-actin immunostaining. Scale bars indicate 100 μm. d Boxplot shows differences in area-normalized PLA signals in benign glands and invasive carcinoma (n = 8 cases). e Immunolabeling for Aim1 (shown in red) and β-actin (shown in green) in urogenital mesenchyme (UGM) and urogenital sinus epithelium (UGE) from mouse embryos at day 17.5 post conception. Note the UGE-specific expression of Aim1, with membranous staining and actin co-localization in bulk UGE (arrowheads), and more diffuse cytoplasmic staining in UGE-derived prostatic buds (labeled B) invading into the surrounding UGM (arrows). Scale bars indicate 100 μm. f Boxplot shows distribution of co-localization coefficients of Aim1 and β-actin immunostaining in UGE close to the urogenital sinus (Bulk UGE) and invading prostatic buds (Bud) (n = 4). g IHC confirms membranous staining pattern of Aim1 in bulk UGE and decreased, diffuse Aim1 immunoreactivity in invading buds. h PLA demonstrates spatial proximity of Aim1 and β-actin UGE close to the urogenital sinus and decreased PLA signals in invading prostate buds. Scale bars indicate 100 μm. i Boxplot shows differences in area-normalized PLA signals in bulk UGE and invading buds (n = 3). All P values are derived using t-test statistics
