Figure 1.

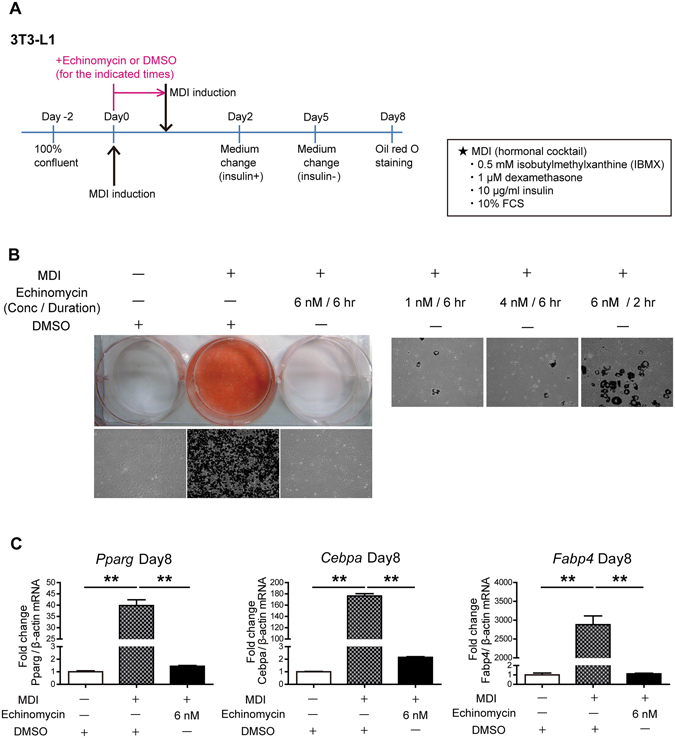
Echinomycin inhibits adipogenesis in 3T3-L1 cells in a time- and dose-dependent manner. (A) Protocol for preadipocyte differentiation and echinomycin treatment: two days after 3T3-L1 cells reached full confluence, they were treated with medium containing a differentiation cocktail containing MDI [10% FCS, 3-isobutyl-1-methylxanthine (0.5 mM), dexamethasone (1 μM), and insulin (10 μg/ml)] for 2 days, and then, for an additional 3 days, the cells were maintained in DMEM containing 10% FCS and insulin (10 μg/ml). Echinomycin or DMSO was added to medium with MDI, and after the times (hr) indicated in each experiment, cells were gently washed to remove echinomycin or DMSO, and the medium was exchanged with fresh medium containing MDI. (B) Oil red O staining 8 days after induction. (Left upper panel) Macroscopic shots of oil red O staining are shown. (Left lower panel) 10x white-black converted shots are presented. The red areas in the colour pictures, which correspond to triglyceride lipid droplets, were converted to black areas for easier comprehension. (Right panel) Lower concentrations or shorter durations of echinomycin treatment of 3T3-L1 cells result in insufficient adipogenesis inhibition, demonstrated by the same method as left lower panel (20x white-black converted shots of oil red O staining at day 8). (C) qRT-PCR analysis of mature adipocyte gene expression in 3T3-L1 cells at day 8. Mature adipogenic genes such as Pparg, Cebpa, and Fabp4 were induced by MDI and suppressed by echinomycin treatment. The data are expressed as the mean ± SEM from three independent experiments. **P < 0.01, as determined by one-way ANOVA with Tukey’s post-test.
