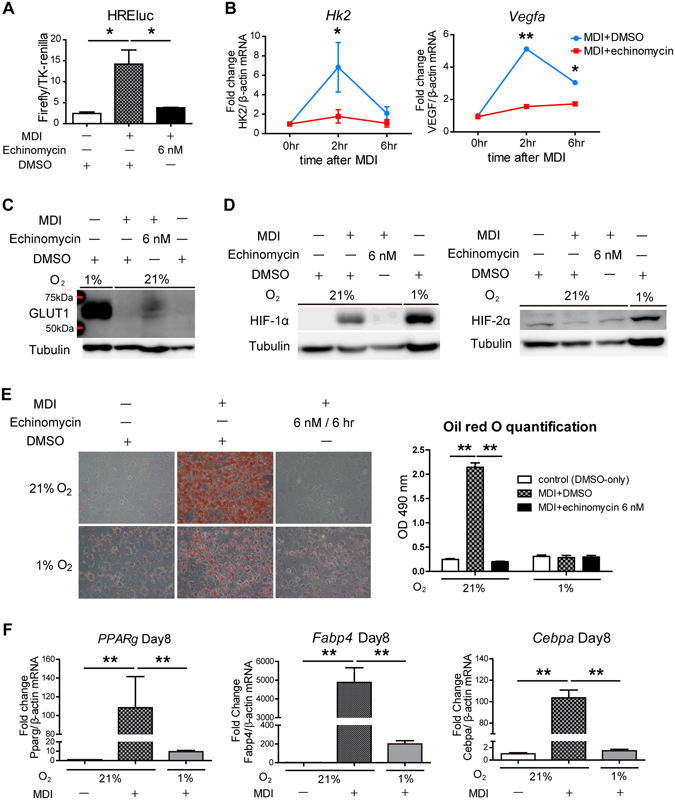
Figure 2.

Echinomycin inhibits adipogenesis independently of the HIF-1 pathway. (A) The ratio of HRE luciferase (HREluc) reporter activity (firefly/TK-renilla) was measured at 8 hr after induction with or without MDI and/or echinomycin treatment. The data are the mean ± SEM of three independent experiments. *P < 0.05 vs. control (only-DMSO treatment), as determined by a one-way ANOVA with Tukey’s post-test. (B) qRT-PCR for representative HIF-1 target genes such as Hk2 and Vegfa at 6 hr after MDI treatment. The data are the mean ± SEM of three independent experiments. *P < 0.05, **P < 0.01, as determined by a two-way ANOVA with Bonferroni’s post-test. (C) Immunoblot analysis of a HIF-1 target gene, GLUT1, in 3T3-L1 cells at 6 hr after treatment with MDI + DMSO or MDI + echinomycin (6 nM). 3T3-L1 cells under hypoxia (1% O2) as the positive control. Full-length blots are presented in Supplementary Figure. (D) Immunoblot analysis of HIF-1α and HIF-2α in 3T3-L1 cells at 2 hr after treatment with MDI + DMSO or MDI + echinomycin (6 nM). 3T3-L1 cells under hypoxia (1% O2) as the positive control. Full-length blots are presented in Supplementary Figure. (D) 20x images of oil red O staining at 8 days after adipogenic treatment ± echinomycin (6 nM for 6 hr) under normoxia (21% O2) or hypoxia (1% O2). Quantification of the Oil red O staining was performed by eluting the dye with isopropanol and measure the OD 490 nm absorbance. The quantification data are the mean ± SEM of three independent experiments. *P < 0.05, **P < 0.01, as determined by a two-way ANOVA with Bonferroni’s post-test. (F) qRT-PCR analysis of mature adipocyte gene expression in 3T3-L1 cells at day 8 under hypoxia. Mature adipogenic genes such as Pparg, Cebpa, and Fabp4 induced by MDI were suppressed by hypoxic condition (1% O2). The data are expressed as the mean ± SEM from three independent experiments. **P < 0.01, as determined by one-way ANOVA with Tukey’s post-test.
