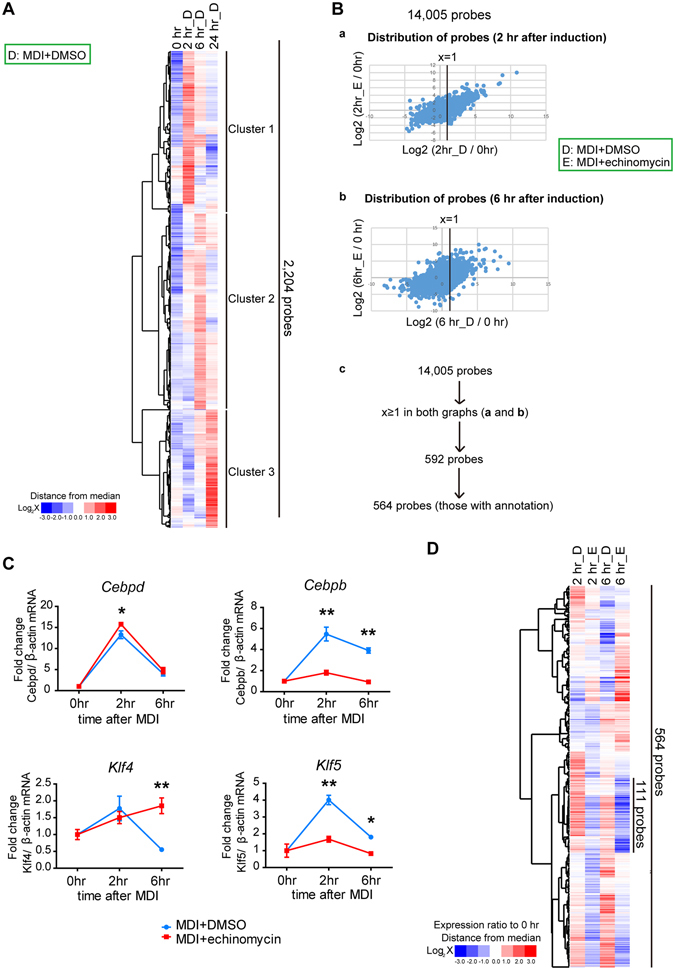
Figure 3.

Time-course DNA microarray analysis of 3T3-L1 cells treated with MDI plus DMSO or MDI plus echinomycin. (A) Clustering analysis performed among the MDI + DMSO treated groups using 2,204 selected probes that had a fold change ≥ 2.0 in expression compared with the control (0 hr) (See the details in Methods). Genes were clustered into 3 groups according to their timing of response to MDI treatment. (B) (a,b) Scatter plot of all the 14,005 probes (signal intensity ≥ 100 at any one point) at 2 hr and 6 hr. A log2-fold change from the control (time 0 hr) of the MDI + echinomycin group is plotted against a log2-fold change from the control (time 0 hr) of the MDI + DMSO group. (c) The scheme of probe selection for further clustering. Genes that had a fold change ≥ 2.0 (x ≥ 1) at both 2 hr and 6 hr relative to time 0 preadipocytes were further analysed using hierarchical clustering. (C) Representative quantitative RT-PCR analysis of Cebpb, Cebpd, Klf4, and Klf5 were performed to validate the microarray analysis. The data are the mean ± SEM of three independent experiments. *P < 0.05, **P < 0.01, as determined by a two-way ANOVA with Bonferroni’s post-test. (D) A heatmap of the expression ratio (compared with 0 hr time point) is shown, and 111 probes are extracted as a cluster containing the genes induced by MDI and suppressed by echinomycin at both 2 hr and 6 hr.
