
Fig. 4.
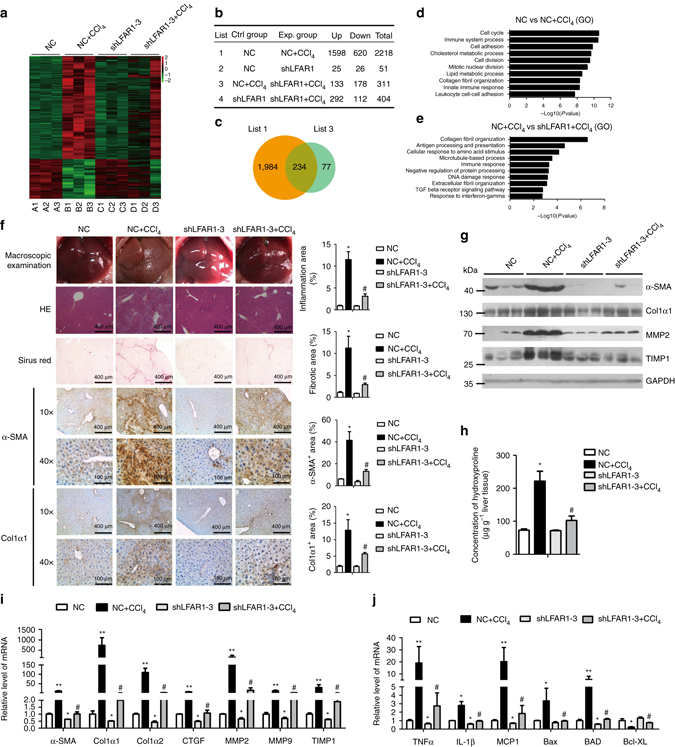
Knockdown of lnc-LFAR1 attenuates CCl4-induced liver fibrosis in vivo. Mice were treated with oil in combination with injection of lenti-NC (negative control, n = 10), or CCl4 in combination with injection of lenti-NC (NC+CCl4, n = 10), or oil in combination with injection oflenti-shLFAR1-3 (shLFAR1-3, n = 10), or CCl4 in combination with injection of lenti-shLFAR1-3 (shLFAR1-3+CCl4, n = 10). a Microarray heat map demonstrates clustering of NC (n = 3), NC+CCl4 (n = 3), shLFAR1-3 (n = 3) and shLFAR1-3+CCl4 (n = 3) Balb/c-mice. Hierarchical cluster analysis of significantly differentially expressed mRNAs: bright green, under-expression; gray, no change; bright red, over-expression. b–e Microarray analyses, such as differential screening b, c and GO analysis d, e, were performed between the four groups. f Liver fibrosis was evaluated by macroscopic examination, H&E staining, Sirius red staining and IHC for α-SMA and collagen1. Scale bars, 400 μm for H&E staining, Sirius red staining and IHC (objective, ×10); 100 μm for IHC (objective, ×40). Right, five images of each liver and five livers from different mice were quantified for each group. g The protein levels of α-SMA, Col1α1, MMP2 and TIMP1 were determined by western blot. GAPDH was used as an internal control. Uncropped blots of this figure accompanied by the location of molecular weight markers are shown in Supplementary Fig. 18. h Quantification of hepatic hydroxyproline content. The data are expressed as hydroxyproline (μg) per liver wet weight (g) (n = 7 per group). i,j The mRNA levels of hepatic pro-fibrogenic genes (α-SMA, Col1α1, Col1α2, CTGF, MMP2/9 and TIMP1) (i), pro-inflammation genes (TNFα, IL1β and MCP1) and apoptosis-related genes (Bax and BAD) (j) were determined by qRT-PCR. In i and j, the number of biological replicates for each experiment was n ⩾ 5. Data are presented as means ± s.e.m. P values were analyzed by one-way analysis of variance followed by post hoc comparison in f, h–j. */#P < 0.05, **/##P < 0.01. *P < 0.05 vs NC, #P < 0.05 vs NC+CCl4