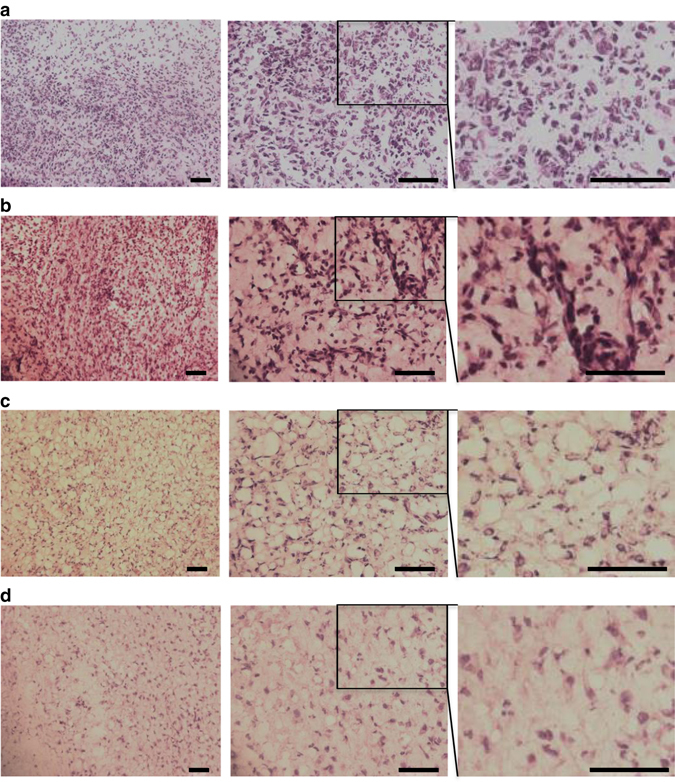
Fig. 6.

Histological analysis of ankle joints. Fresh-frozen sections (10 µm) of joints treated respectively with: a, BVCAR alone; b, HAdV5-PUMA alone (109 PFU); c, BVCARHAdV5-PUMA (107 PFU); d, BVCARHAdV5-PUMA (109 PFU); were stained with haematoxylin and eosin staining, and compared for the presence of synovial tissue infiltrates. The representative photograph from each group is provided at various magnifications (×200, left; ×400, middle; and ×800, right). The righmost panels are enlargements of the rectangular area delineated in the middle panels. Scale bar, 200 µm
