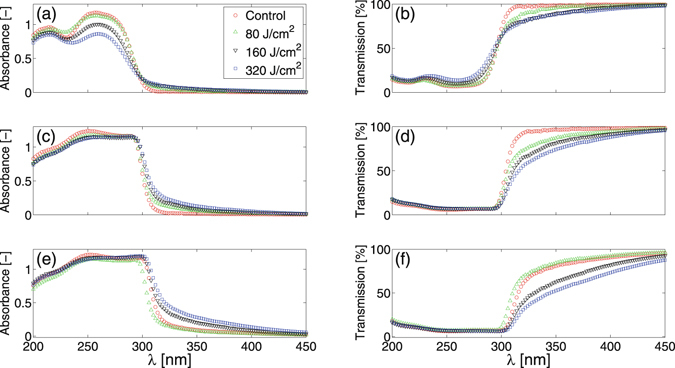
Figure 3.

Effects of UVB irradiation. Absorbance (left column) and transmission (right column) plotted against wavelength, λ, for films with a surface density of 0.0031 mg/mm2 (top row), 0.0124 mg/mm2 (middle row) and 0.031 mg/mm2 (bottom row). Each of the panels (a–f) display the average (n = 3 individual films for each dosage) absorbance or transmission spectrum prior to UVB irradiation (Control: red circle) and after UVB dosages of 80 J/cm2 (green triangle), 160 J/cm2 (black inverted triangle) and 320 J/cm2 (blue square). Standard deviations in all cases are smaller than the symbol size and have not been plotted to improve visual clarity.
