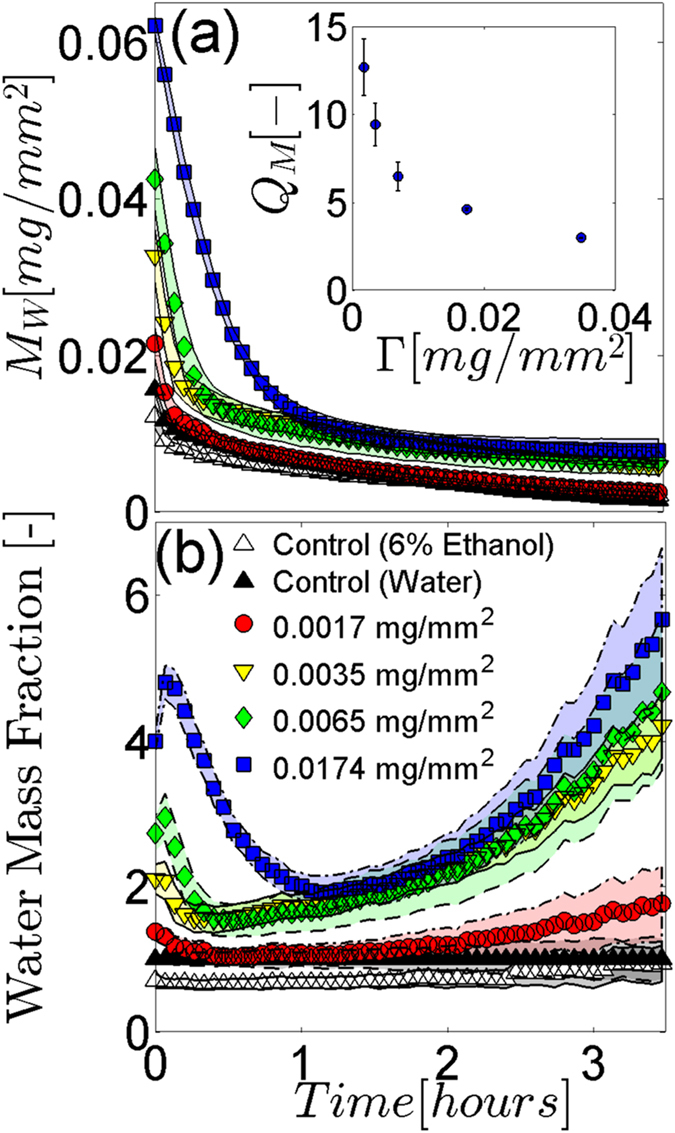
Figure 7.

Evaporation kinetics of DNA film coated SC. (a) Average area scaled water mass, M W, of control and DNA film coated SC samples drying over time in a 24% R.H. environment. Control results include SC samples coated with DIW water (black triangle) and 6% aqueous ethanol solutions (white triangle). DNA film coating results include surface densities of 0.00173 (red circle), 0.00347 (yellow inverted triangle), 0.00694 (green diamond), and 0.0174 mg/mm2 (blue square). Shaded regions denote standard deviations of n = 3 individual SC samples. (Inset) Average mass swelling ratio, Q m, plotted against DNA film surface density, . Error bars denote standard deviations of n = 3 individual SC samples. When not visible, errors are smaller than the symbol size. (b) Results from panel (a) scaled by the DIW coated control results (black diamond). Shaded regions denote propagated standard deviations.
