Fig. 1.

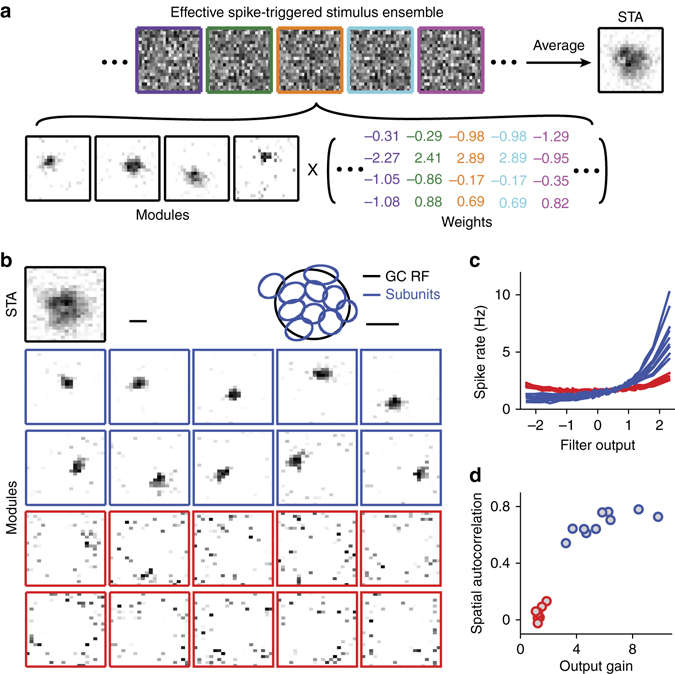
Identification of subunits with STNMF. a Illustration of STNMF analysis. Samples of a ganglion cell’s effective spike-triggered stimulus ensemble (top), whose average corresponds to the cell’s spike-triggered average (STA). For easier visual comparison with the subunits, STAs are here and in subsequent plots displayed with negative pixel values set to zero and with zero corresponding to white in the greyscale image. STNMF decomposes this ensemble into a set of modules and a weight matrix (bottom). The example here shows four modules that were identified for a sample ganglion cell. b Modules obtained for another sample ganglion cell by applying STNMF with 20 modules. Some modules have a strongly localized structure (blue frames), others are more noise-like (red frames). The top row shows the cell’s receptive field, given by the spatial component of the STA, as well as the fitted receptive field outline (GC RF, black ellipse), together with outlines of the localized subunits (blue ellipses). Scale bars, 100 µm. c Nonlinearities for the 20 modules, with colors corresponding to the frame colors in b. d Quantification of spatial autocorrelation, obtained as Moran’s I, vs. output gain, obtained as the spike-rate range of the nonlinearities shown in c, for the 20 modules. Colors as in b and c
