Fig. 2.

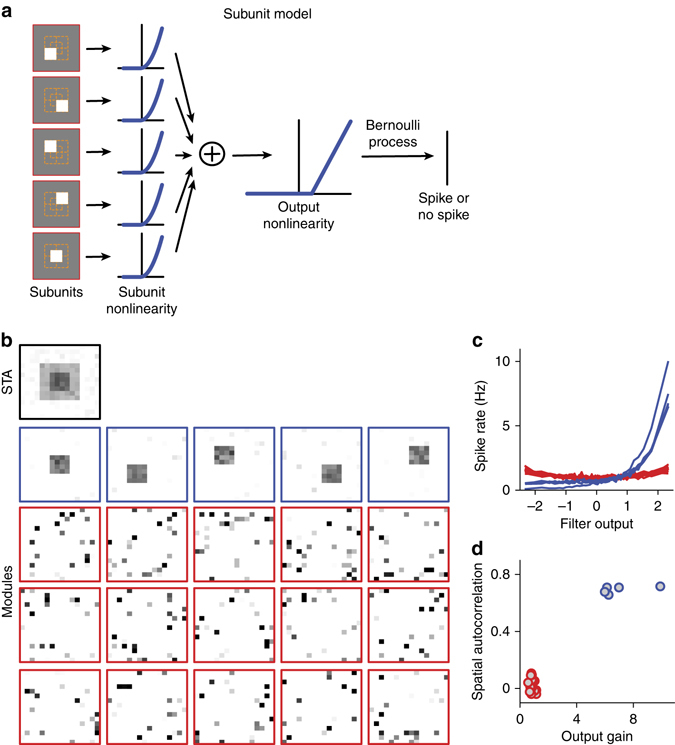
Identification of overlapping subunits with STNMF for a model neuron. a Model structure. Stimuli are here spatial patterns of 16 × 16 pixels of Gaussian white noise. The model contains five subunits, each covering a 4 × 4 region of the input space. The first four subunits tile the central 8 × 8 region of the input space; the last subunit is located in the center of the input space, overlapping partly with each of the other four subunits. The filter output of each subunit is transformed by a threshold-quadratic subunit nonlinearity before summation and application of a threshold-linear output nonlinearity with a positive threshold at unity to make spiking sparse, like in the observed recordings. This yielded a spiking probability that was used to determine actual spikes according to a Bernoulli process. b–d, STNMF analysis of simulated data, using 3500 spikes. STA as well as identified modules (b), nonlinearities corresponding to the modules (c), and analysis of spatial autocorrelation vs. output gain (d) are shown like in Fig. 1b–d. The analysis faithfully recovered the original subunits despite their spatial overlap
