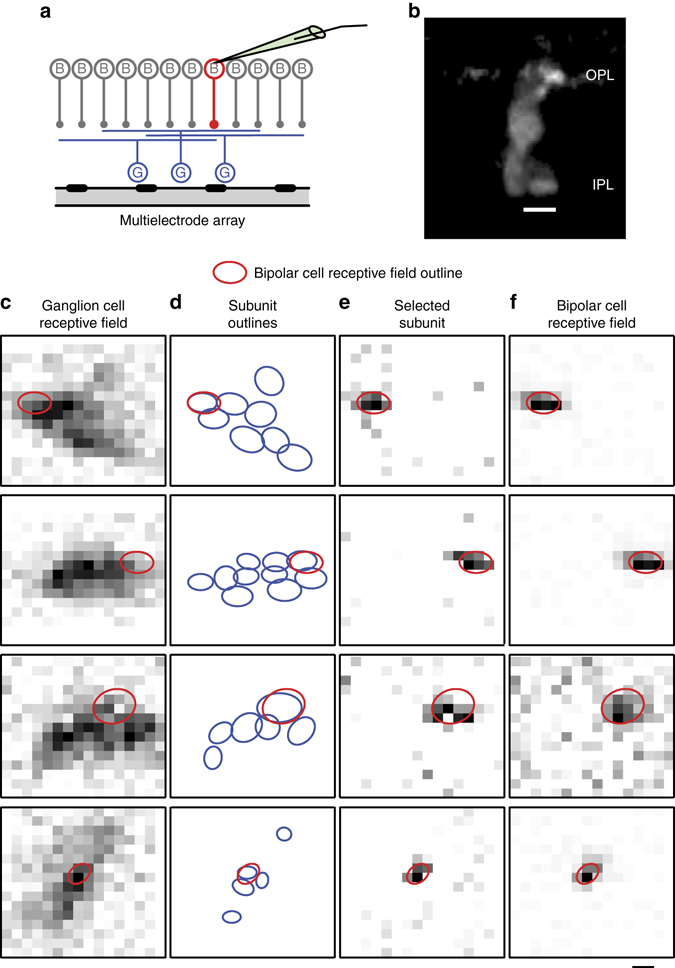
Fig. 3.

Comparison of ganglion cell subunits and simultaneously recorded bipolar cell receptive fields. a Illustration of the experiment (left), where one bipolar cell (B, red) is recorded with a sharp microelectrode, while multiple ganglion cells (G, blue) are simultaneously recorded with a multielectrode array. b Sample staining of a bipolar cell that was imaged after the combined intracellular and multielectrode-array recording, displaying neurites both in the outer plexiform layer (OPL) and inner plexiform layer (IPL). Scale bar, 10 µm. c Pixel-by-pixel representation of ganglion cell receptive fields, obtained as the spatial component of the spike-triggered average under spatiotemporal white noise. The red ellipse here and in subsequent panels shows the receptive field outline of the simultaneously recorded bipolar cell. d Outlines of identified subunits (blue ellipses). e Pixel-by-pixel representation of the best matching identified subunit. f Pixel-by-pixel representation of the bipolar cell receptive field, obtained as the spatial component from the corresponding reverse correlation analysis. Scale bar, 100 µm
