
Figure 4.
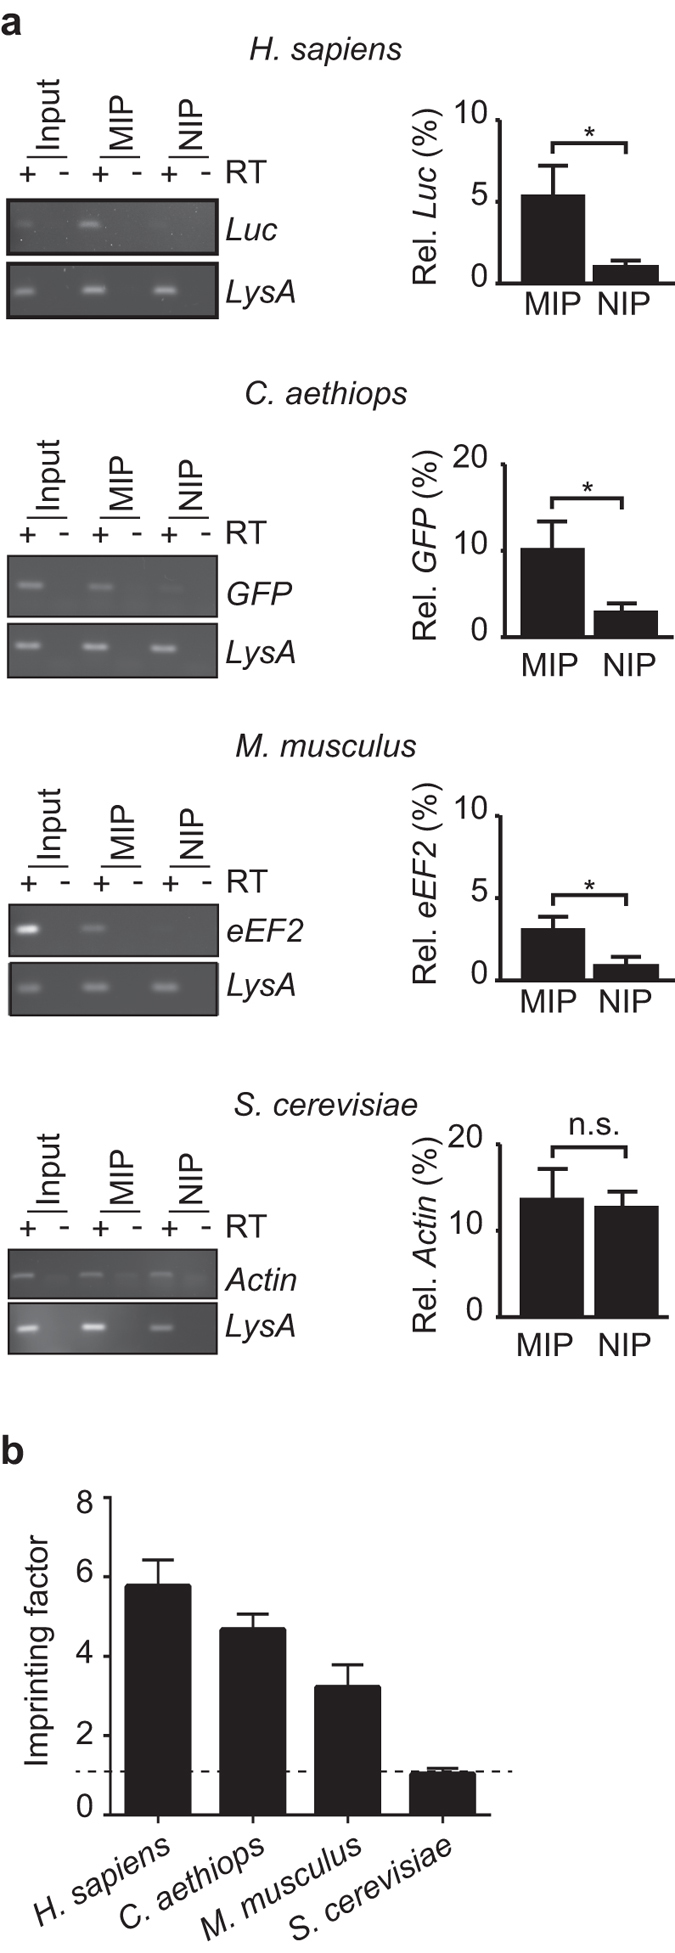
Human R-MIPs can be used to recover ribosome-associated mRNAs from cellular extracts of closely related eukaryotic species. (a) Detection of the indicated mRNAs from the specified species in extracts, MIPs and NIPs. RT-PCR products were visualised on agarose gels shown to the left. LysA is a spiked-in control used for normalisation. Images of uncropped gels and blots are shown in the Supplementary Fig. S1. The chart to the right shows relative recovery of indicated mRNAs with MIPs or NIPs as compared to the input extract (100%). RNA was quantified by RT-qPCR with the ΔΔCt method and normalised to LysA (see Methods). Standard error of means (SEM) are shown as bars; H. sapiens, n = 5, Luc reporter (pGL3) in HeLa cells; C. aethiops, n = 6, GFP reporter in VK219 cells; M. musculus, n = 5, endogenous eEF2 mRNA in C8-D1A cells; S. cerevisiae, n = 3, actin mRNA in yeast. *P < 0.05, two-tailed homoscedastic student’s t-test. (b) Imprinting factor (mean ± SEM) related to specified species ordered according to the evolutionary distance from human. The dotted line marks an IF of 1, indicating no preferential binding to MIP compared to NIP.