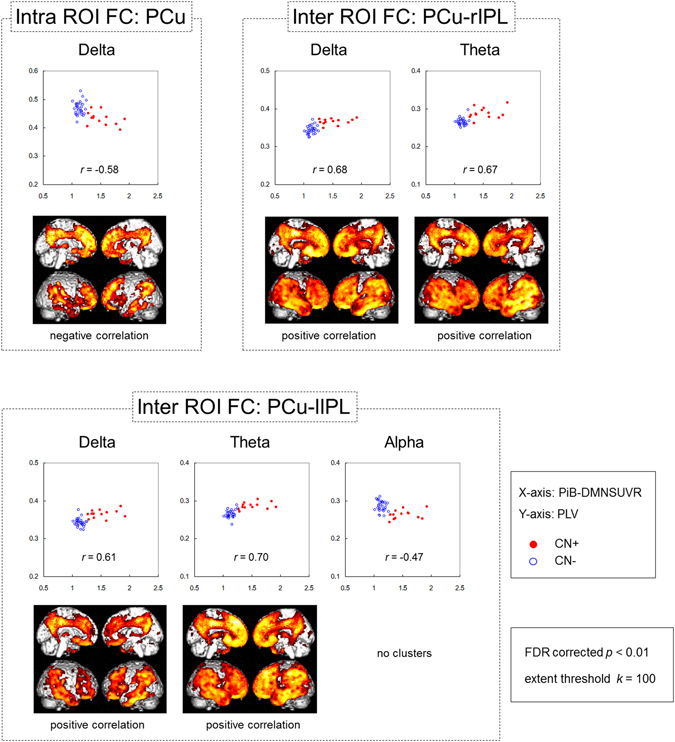
Figure 3.

Correlations between each MEG FC marker and cerebral amyloid deposition. The scatter plots show correlation between the PiB-DMNSUVR values (x axis) and PLV (y axis). The closed red circles and open blue circles indicate CN+ and CN− individuals, respectively. The brain images display the results of regression analysis between PiB-SUVR images and each MEG FC marker’s PLV. Brain areas that showed statistically significant correlations between regional PiB retention and each biomarker are visualized. The height threshold is p < 0.01 (FDR corrected), and the extent threshold is k = 200 voxels in all images. Note that the regression analyses for PCu-lIPL alpha showed no significant clusters with the above thresholds. FC: functional connectivity, DMNSUVR: mean standardized uptake value ratio (SUVR) within the default mode network (DMN). PLV: phase-locking value, CN+: cognitively normal PiB-positive, CN−: cognitively normal PiB-negative, FDR: false discovery rate, PCu: precuneus, lIPL; left inferior parietal lobule.
