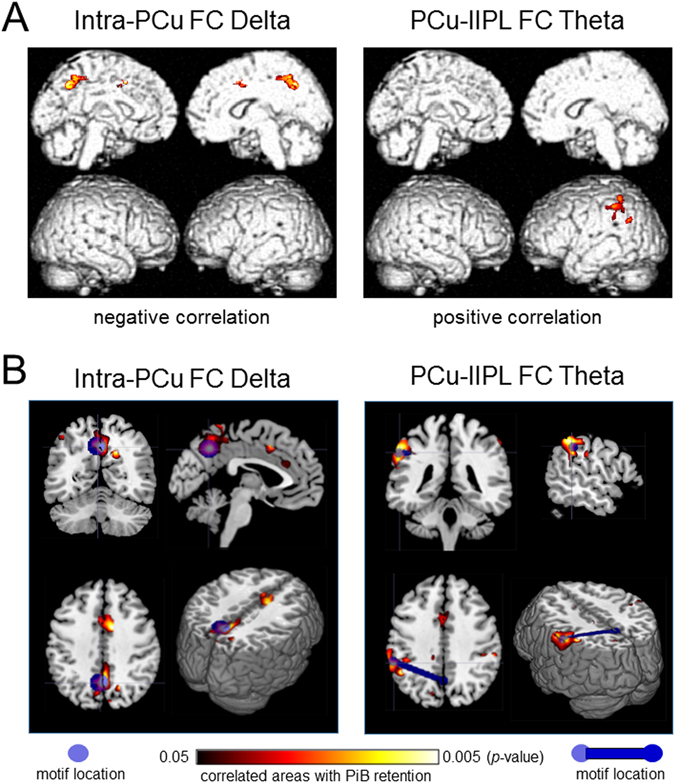
Figure 4.

Results of the within-group correlation and regression analyses. (A) Results of regression analysis between PiB-SUVR images and values of MEG FC markers. Correlated areas within a DMN-ROI mask are visualized. The height threshold is p < 0.01 (uncorrected), and the extent threshold is k = 100 voxels in all images. (B) Topographical relationships between the network motif and the correlated areas between the FC values and PiB retention. The motif locations are represented by the center of gravity at each ROI. SUVR: standardized uptake value ratio, FC: functional connectivity, DMN: default mode network.
