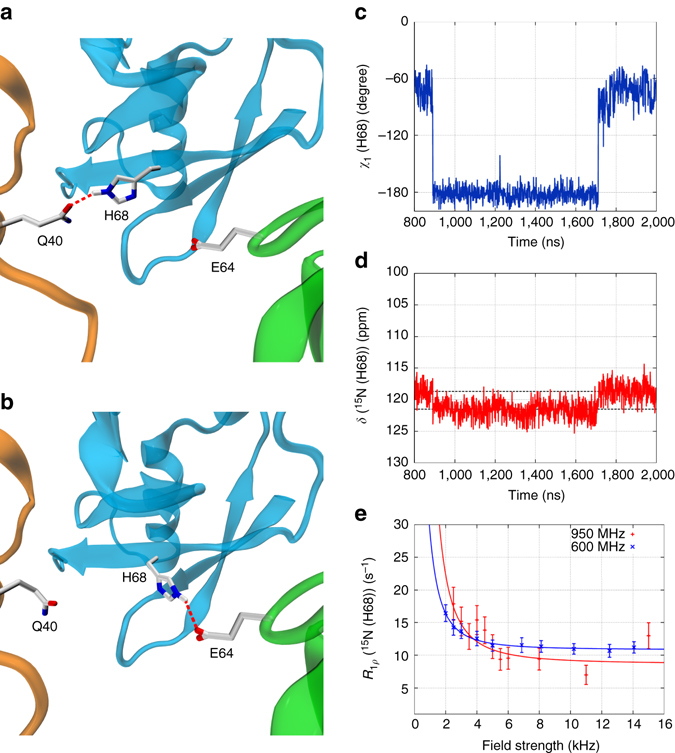
Fig. 6.

Microsecond time scale dynamics of residue H68 (chain A) in cubic-PEG-ub crystals. a, b Intermolecular hydrogen bonds alternatively formed between H68 and Q40 or E64 as seen in the MD simulation of cubic-PEG-ub. c, d Time variation of side-chain torsional angle χ 1(t) and main-chain 15N chemical shift δ(t) for residue H68 in the selected ubiquitin molecule from the simulated unit crystal cell. e Experimental relaxation dispersion data for residue H68 (chain unassigned) in the cubic-PEG-ub crystal; also shown are the results of fitting using fast exchange model (continuous lines). Error bars of R 1ρ values were determined from Monte Carlo analysis. The motional time scale according to the experimental data, 56 μs, is one-to-two orders of magnitude slower than suggested by the MD simulations (the same is true for other manifestations of μs dynamics in ubiquitin crystals). The animated version of this graph is available as Supplementary Movie 3
